The Climate Risk and Decisions Group in the Western Water Assessment works to understand how weather and climate data can aid social responses to weather and climate variability. We build adaptation simulation models both as a research approach and as tools to help decision-makers use climate and other environmental data for more effective response to changing conditions.
Two new risk and decision models have been added:
The Culverts Model assesses strategies for stormwater and culvert management over time with extreme events and a changing climate.
The Drought, Ranching, and Insurance Response Model (DRIR) simulates decision making on a western cattle ranch in the face of drought, and with different insurance options.
For more information on the Climate Risk group, contact:
William Travis
william.travis@colorado.edu
What We Do: Climate Adaptation Decision Research
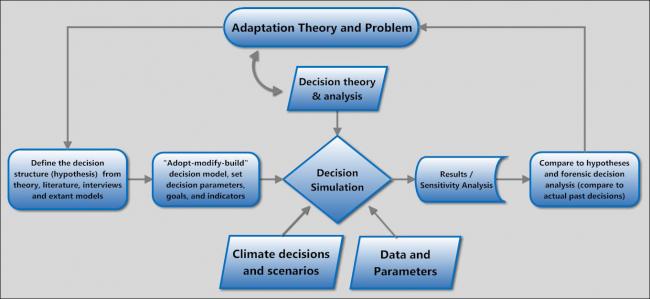
Risk and decision analysis is a mostly normative set of methods for making choices under uncertainty. We apply decision analysis as a research tool by giving more weight to studying the decision context and structure at the front end, and post-hoc, forensic decision analysis at the back end, as illustrated here, to test theories and research hypotheses. Our approach aims to create realistic decision models that can be simulated under historical and projected conditions, subjected to extensive sensitivity analysis, and that can be used and revised by actual decision makers. We are developing a set of decision models aimed at understanding, and simulating, the decision process for response to climate variation among resource managers like farmers, ranchers, flood managers, and others.
Besides gaining new insights into the process of climate adaptation, our challenge is to simulate the decision process so that researchers and managers can examine the implications of multiple factors and decisions, and thus get a feel for how sensitive choices are to uncertain conditions. Decision analysis as a learning tool can:
-
Help analysts and decision-makers recognize the structure, trade-offs, and likely outcomes of a range of choices made under uncertainty;
-
Provide tools for testing how sensitive decisions are to climate variation, to improved information, or to down-side risks;
-
Suggest optimum, robust, or least-regret decisions.
We also have a special interest in extreme events and decisions driven by extremes.
The Climate Risk Management Test-Bed
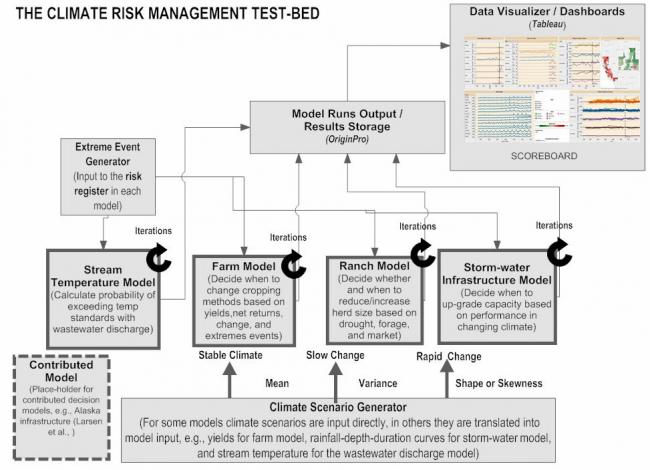
The test-bed is comprised of a suite of decision models designed to simulate climate impacts in agriculture and infrastructure and allow testing of various responses using principles of decision analysis such as maximum expected utility, decision scaling and sensitivity analysis, game theory, and options analysis. The test-bed includes working models (FarmAdap and StreamTemp) available for download from this webpage. Models under development include a simulation of rancher decision-making during drought and a pathways model to judge the performance of flood control and stormwater systems under a changing climate.
Farm Adaptation Models
 FarmAdap simulates costs, production, and net income for a 2,000 acre drylandwheat farm on the U.S. Great Plains, with the goal of modeling the impacts of climate variation, especially extreme events and rapid climate change, and the timing of farmer adaptation. Climate change is input via off-sets to the yield distribution from which the farm draws each year in a 30 year simulation. The model is calibrated on actual yield data for central North Dakota wheat production, plus a set of scenarios of gradual or rapid change as well as extreme events. Yield data could be input from, for example, a historical time series of a particular farm, county or climate division, or future yields simulated by a combination of climate scenario and crop yield modeling.
The model is designed in two formats. The DynamicFarmAdap version simulates change over time so that the farmer might chose to adapt at any time given changing conditions and some rules about when to adapt.
You can run a simple version of DynamicFarmAdap on Analytica's "Cloud Player". We have loaded the cost, yield, and price data, and if you simply run the model (by clicking either of the "Calc" buttons) you will get results for all the scenarios and be able to scroll through "slices" to see all the output. We have given the farmer the choice of switching methods from continuous cropping (common in the region) to an alternate fallow system (common further west in drier areas, and generally producing a slightly higher yield) if the continuous cropping yields decline too much. You can set the income threshold for this switch in the user interface. We start at $-50,000 for reasons described in the accompanying paper. Results then give you the future incomes for the non-adaptive (stays with continuous cropping) and the adaptive (switches) farmer. You can view the details of the model by clicking on the "Model" node in the center.
You can also download the dynamic model here and change inputs and run it (even without access to the full software), by downloading the Analytica Free 101 player. Once you have down-loaded the free Analytica player and downloaded the model from this site, you can run it and explore the results in more detail, and you can change some of the parameters for custom simulations.
NPVFarmAdap is not a dynamic simulation as with the Analytica version described above, instead it calculates the net present value (NPV) of different cropping strategies for each climate scenario (see the worksheet tabs) over a 30-year simulation period. This spreadsheet model was developed in the @Riskdecision tool from Palisade Software where you can download a trial version of the DecisionTools Suite add-in for Excel.
View a poster using FarmAdap: "An Agent-centered Decision-analytic Approach to Climate Change Adaptation".
Crop Switching Models
 The CropSwitch model suite uses actual crop production budgets to calculate the relative performance of alternative crops; the version here was designed to test the likely emergence of winter wheat under a warming climate in the spring wheat production region of North Dakota. The three models in the suite include: Crop Switch Base which calculates of outcomes for spring wheat, spring wheat fallowed, and winter wheat, for a base year (production data for 2014, as shown in the model inputs data table to the right). A decision tree is appended below the @Risk model to allow for two-way sensitivity analysis, a way to test for statistical dominance of a decision over a range of factors, in this case the yield benefit of a switch and the differential costs of insurance (for runs including crop insurance). The model incorporates a risk register that forces complete crop loss into the simulation runs at a specified binomial probability to simulate winter kill for winter wheat and drought loss for spring wheat. It also includes a crop insurance calculator in which winter wheat coverage, not currently available, is simulated to emerge in the future. Crop Switch Risk Tree calculates risk tolerance via an exponential utility function built into the tree. The tree can be set to calculate, for a given R value (set in cell B4): (1) Expected Value (EV); (2) Expected Utility (EU); or (3) Certainty Equivalent (CE). Tables 1, 2 and 3 calculate a risk premium. Crop Switch Time allows calculation of outcomes for spring wheat and winter wheat over a 30-year scenario or "Representative Agricultural Pathway" (RAP). It compares net present values (NPV) of crop switching at different points in the simulation, with winter kill reduced slowly or quickly (e.g., slow or fast climate warming), and with the "emergence" of a insurance instrument at a point in the time series determined by a probability of winter kill set by the user.
These models were developed in the @Risk decision tool suite from Palisade Software where you can download a trial version of the DecisionTools Suite add-in for Excel. The versions loaded here have the @Risk functions turned off so you should be able to view the last run results in Excel without the @Riskadd-in. With @Risk you can switch the functions back on and conduct modified runs.
View a poster using CropSwitch: "Climate Warming and Crop-switching in the Northern Great Plains Dryland System".
The Stream Temperature Model
 StreamTemp simulates the interaction of stream temperature and discharge with effluent temperature and discharge, with the goal of assessing the likelihood of exceeding downstream temperature targets under different conditions imposed by short and long-term climate variation. To do this we built a simulation model in @Risk that performs the necessary calculations for given wastewater discharge settings and different climate scenarios on the Colorado Front Range. StreamTemp calculates the probability of downstream temperature exceeding stream temperature standards by combining upstream discharge and temperature with effluent discharge and temperature in a mixing zone downstream of the treated-water discharge point. Model inputs can be specific values, means, or probability distributions. When the inputs are probability distributions, the software applies Monte Carlo simulations to produce a distribution for downstream temperature (DST). The portion of the DST distribution that exceeds the stream temperature standards is the probability of exceeding (POE) stream temperature standards. For the simulations reported here we used historical data from medium-to-large streams on the Colorado Front Range to produce a mean and standard deviation stream discharge for each month of the year, transformed these into monthly distributions for up-stream discharge, and extrapolated those monthly into daily values using a linear function. The user interface also allows for direct input of daily data if available. For effluent discharge we used data on outputs from a sample of actual wastewater treatment plants in the region, these data were averaged to create a hypothetical treatment plant for the simulations contained in the model as downloaded here; users with the @Risk add-in tool can input data specific to a particular treatment plant and run the simulations in sensitivity analysis mode to determine how close they are to passing temperature threshold.
Related Publications
W.R. Travis and A. McCurdy (working paper) Incorporating Risk into Climate Adaptation: Decision Analysis of Crop Switching in a Changing Climate.
Clifford, K. and W. Travis (working paper) Knowing Climate: The Anatomy of Experienced Climate Knowledge in Colorado’s Gunnison Basin.
Huisenga, M., Travis, W. (2015) Climate variability and the sensitivity of downstream temperature to treated wastewater discharge: a simulation analysis. Environment Systems and Decisions 35, 11-21. DOI 10.1007/s10669-014-9532-3
Travis, W.R. (2014) Weather and climate extremes: Pacemakers of adaptation? Weather and Climate Extremes 5–6, 29-39. DOI 10.1016/j.wace.2014.08.001
W.R. Travis and B. Bates (2014) What is Climate Risk Management? Climate Risk Management 1, 1-4. DOI 10.1016/j.crm.2014.02.003
W.R. Travis (2013): Design of a Severe Climate Change Early Warning System. Weather and Climate Extremes 2: 31-38. DOI 10.1016/j.wace.2013.10.006
W.R Travis and M. Huisenga (2013) The Effect of Rate of Change, Variability, and Extreme Events on the Pace of Adaptation to a Changing Climate. Climatic Change 121: 209-222. DOI 10.1007/s10584-013-0876-3
Travis, W. R., and Z. Johnson. (2013). Tracking Socioeconomic Impacts of Drought with Rapid Analytics and Dashboards. Western Water Assessment White Paper.
Travis, W. R., and R. Klein. (2012). Socioeconomic Impacts and Adaptation Strategies: Assessing Research on Quantification of Drought Impacts. Western Water Assessment White Paper.
Travis, W. R., K. Gangwer, and R. Klein. (2011). Assessing Measures of Drought Impact and Vulnerability in the Intermountain West. Western Water Assessment White Paper.
W.R. Travis (2010) Going to Extremes: Propositions on the Social Response to Severe Climate Change. Climatic Change 98: 1-19. DOI 10.1007/s10584-009-9661-8
For more information:
William R. Travis
Department of Geography
University of Colorado
260 UCB
Boulder, CO 80309-0260
303-492-6312
william.travis@colorado.edu