Climate Information Resource
This two-page document provides brief descriptions and links to various climate resources that provide information about current climate conditions, relevant weather and climate forecasts, climate information dashboards, climate summaries, and climate change resources.
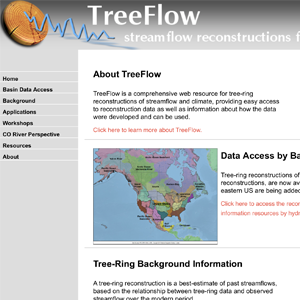
TreeFlow
TreeFlow is a comprehensive web resource for tree-ring reconstructions of streamflow and climate, providing easy access to reconstruction data as well as information about how the data were developed and can be used. TreeFlow was developed and is maintained by WWA and CLIMAS, providing tree-ring reconstructions of annual streamflow for over 60 gages across the U.S., over 30 of which are within Colorado, Utah, and Wyoming. It also has links to tree-ring reconstructions of precipitation, drought indices, and snowpack.

Drought Index Portal
This application displays two side-by-side panels of drought indices and/or climate variables over the Contiguous United States for comparison. For each panel, you may select an index or variable from the list below this description. Data was acquired from the WestWide Drought Tracker of the Desert Research Institue, NOAA's Physical Sciences Division, and the PRISM Climate Group.
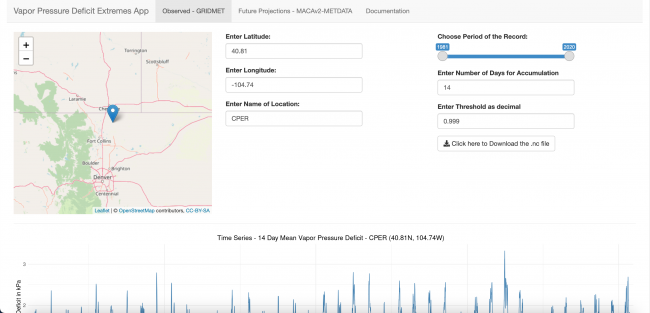
Vapor Pressure Deficit Extremes App
The goal of this app is to quantify and visualize the extremes in VPD at different timescales (weeks to months) that have occurred in the recent historical period (1981-2020) and projected in future under various climate scenarios for any location within the Contiguous United States (CONUS).
This application allows a user to:
- Quickly acquire VPD data for a single point location as an nc file
- Quantify, visualize and ability to download mean VPD for a user selected timescale as number of days
- Quantify, visualize and download number of extreme events per year for a user selected threshold and timescale
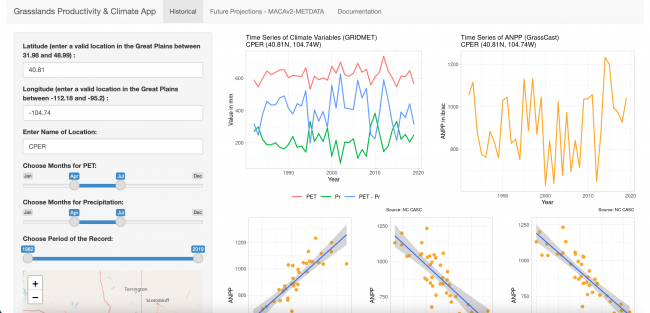
Grasslands Productivity Climate App
This app quantifies relationships, based on linear regression, between 'observed' grasslands productivity and different climate variables (that includes precipitation, potential evapotranspiration (PET), PET minus precipitation) for a point location in the US Great Plains, and apply those relationships to project grasslands productivity into the future under different climate scenarios.
This application allows a user to:
- Quickly acquire annual time series of 'observed' historical ANPP and climate data for a point location as .csv
- Select different timescales for climate variables to assess the relationship between ANPP and climate
- Quantify and visualize the relationship between 'observed' historical ANPP and different climate variables
- Quantify, visualize and download (data as .csv) annual time series of future projections of climate and ANPP
- Estimate and visualize projected mean ANPP for a selected future time period and compare it to the historical mean.