Intermountain West Dashboard
Western Water Assessment needs your help improving the Intermountain West Dashboard! Please share your input in this short, anonymous survey which should take less than 5 minutes to complete.
The Intermountain West Dashboard provides situational awareness of weather, drought, and water resources for Colorado, Utah, and Wyoming.
Click the question mark icon above each graphic to see the description of that graphic.
Weekly or monthly summaries of evolving weather, drought, and water conditions for the Intermountain West are also available from these providers:
- Colorado CC/NIDIS Intermountain West Drought Status Briefings
- NOAA CBRFC Water Supply Briefings for the Colorado River Basin and Great Basin - monthly, January through May
- NRCS Water Supply Outlook Reports for Colorado, Utah, and Wyoming - monthly, January through May/June
Temperature, Precipitation and Snowpack


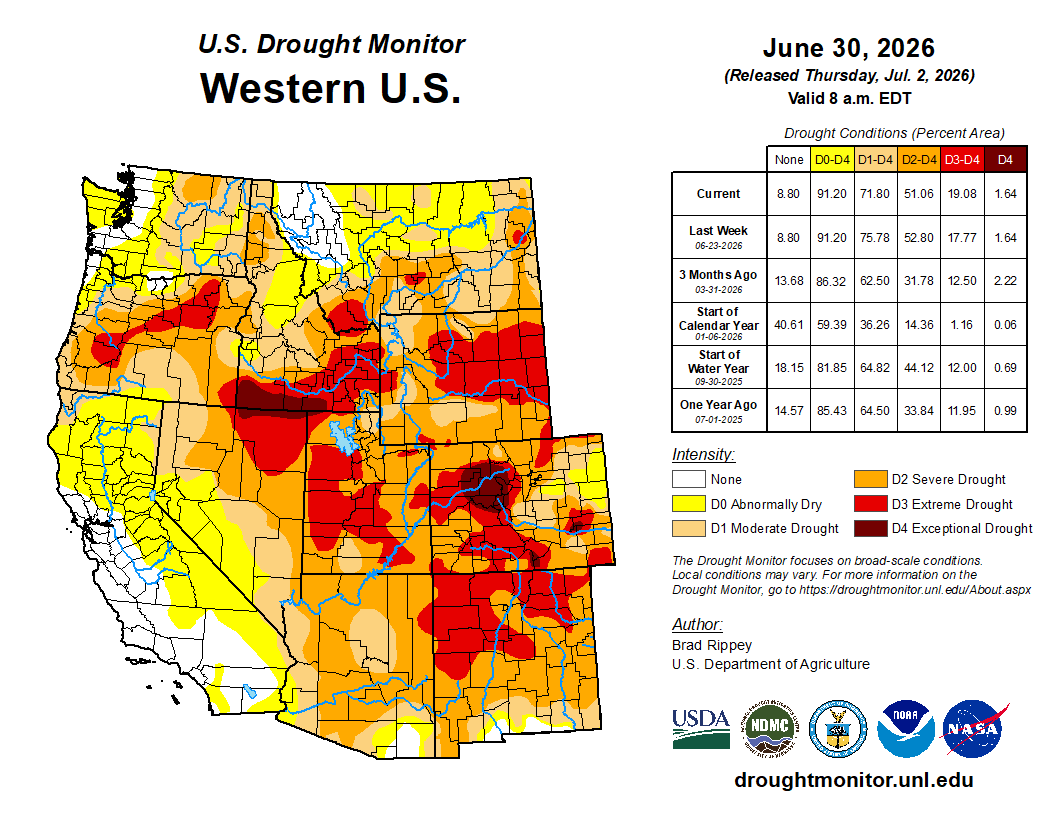
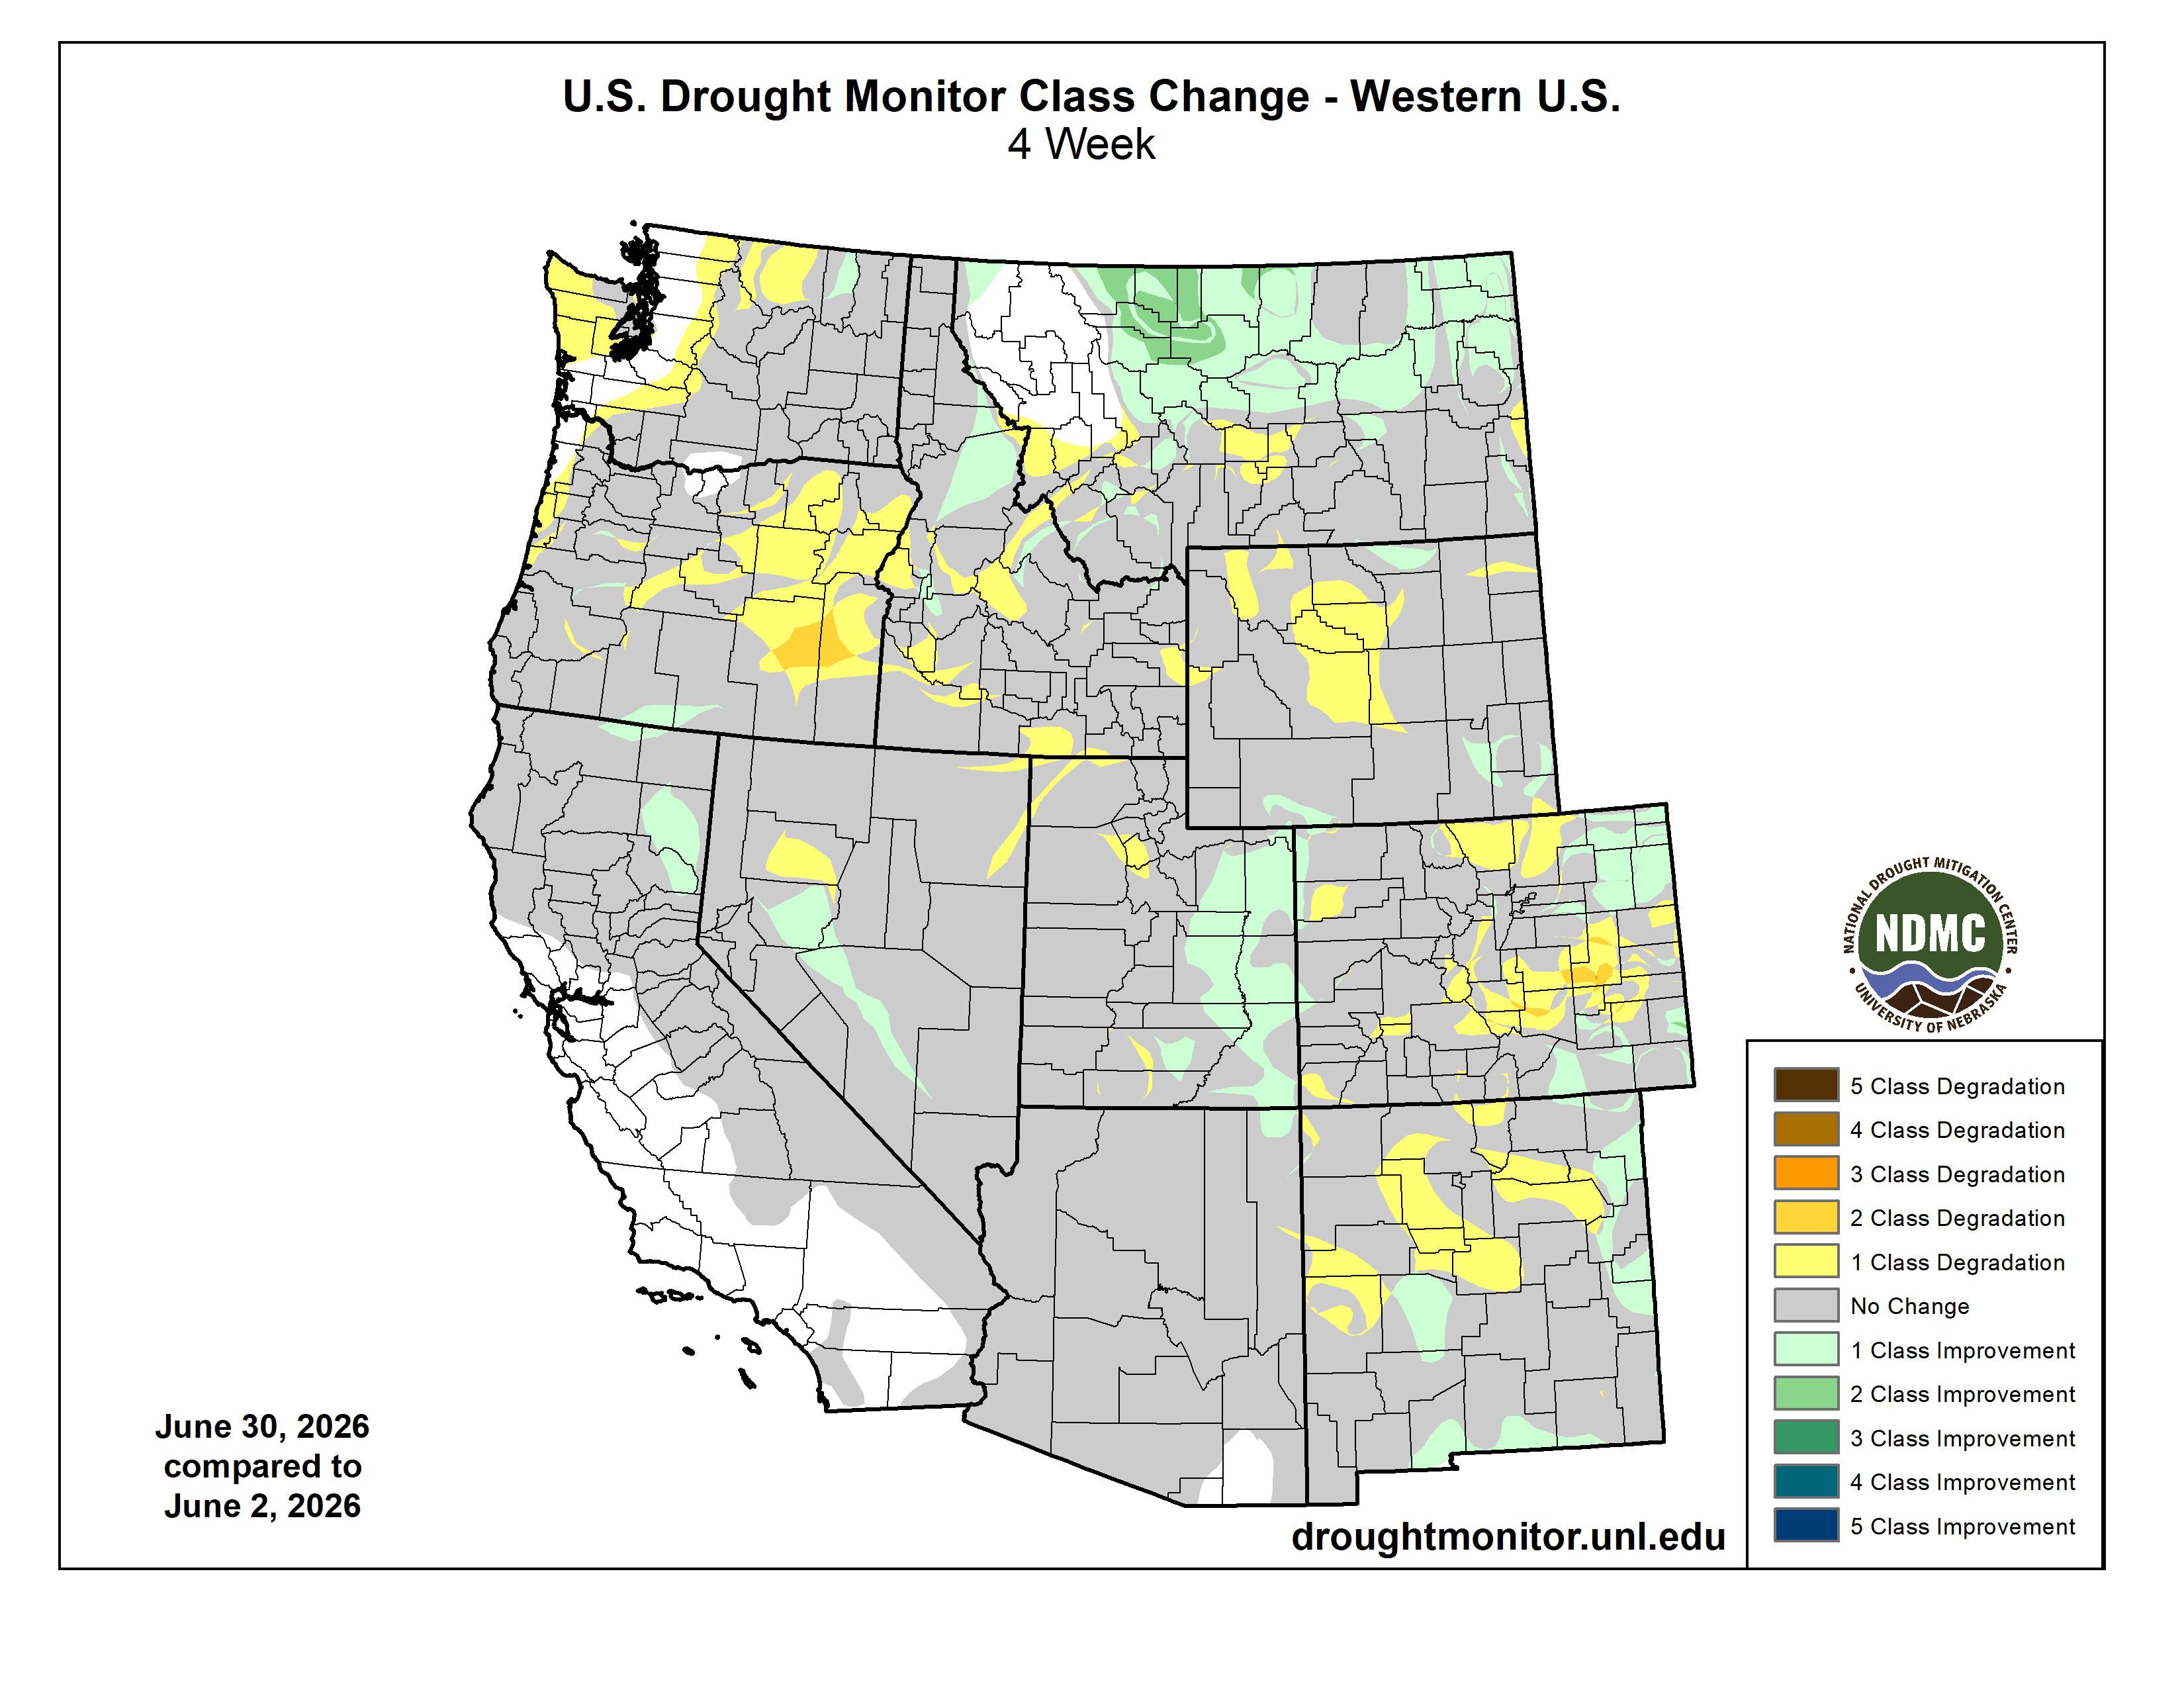
Drought Conditions


Current Streamflow, Forecasted Streamflow

Soil Moisture


Wildfire and Smoke
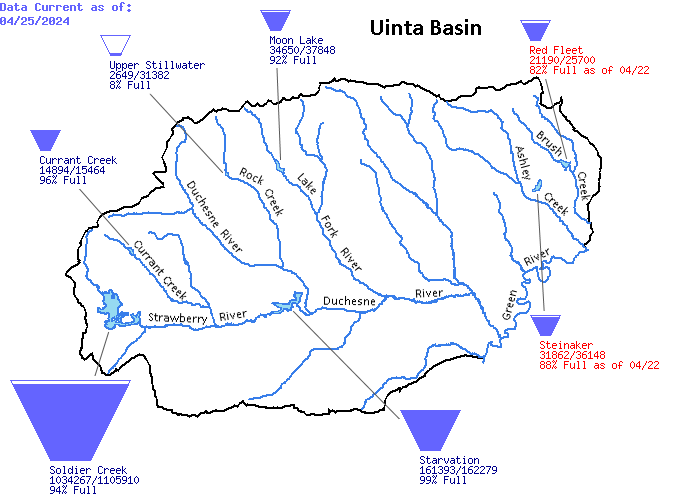
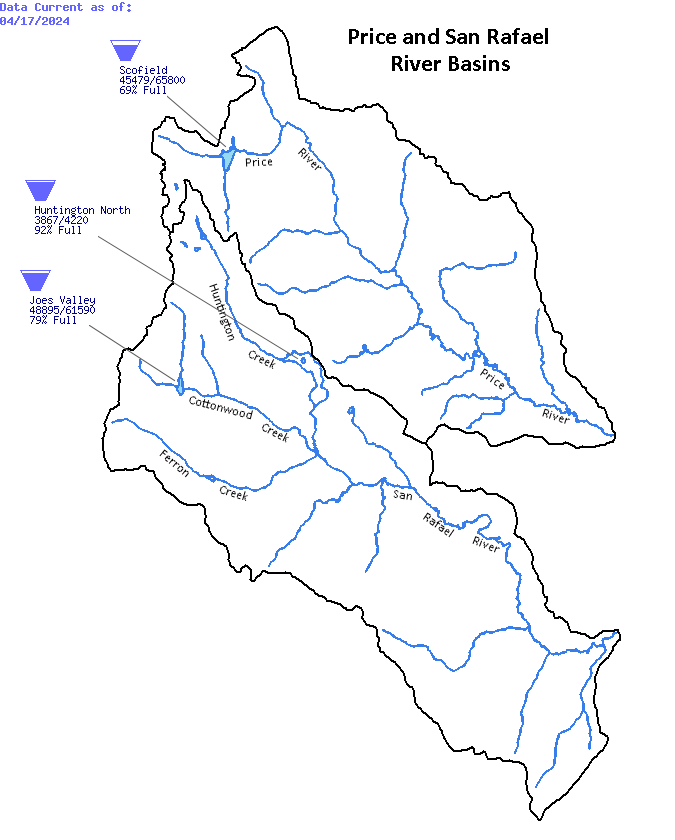
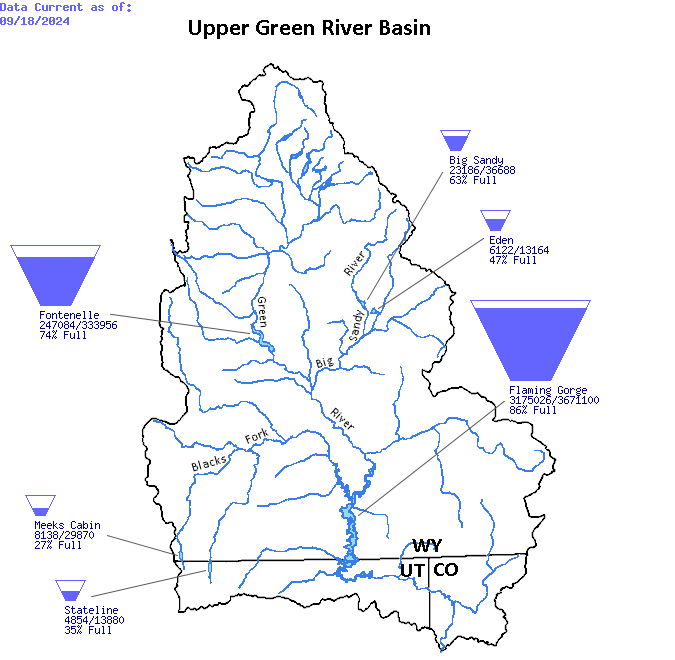
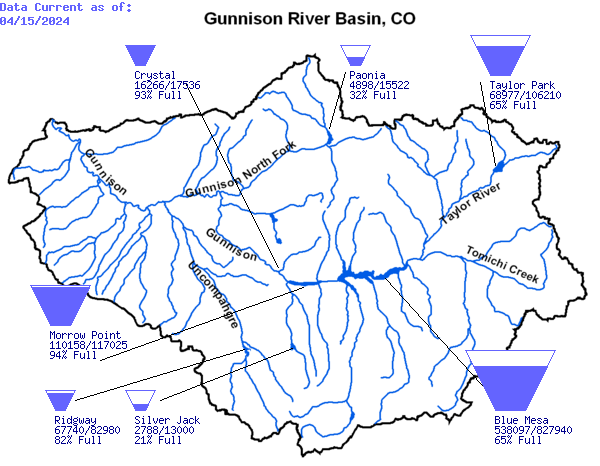
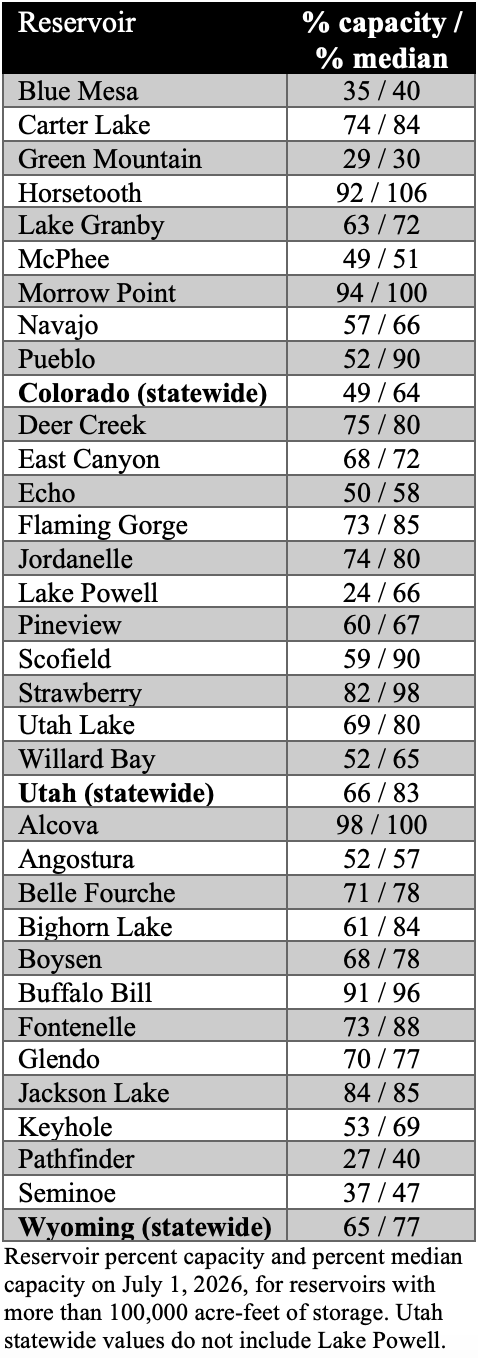
Reservoir Storage
Precipitation Forecast
Seasonal Climate Outlooks
Experimental Winter Precipitation Forecast
( This tool is out of date. A new version will be available soon. )


ENSO Conditions and Forecasts


Latest Briefing
July 9, 2026 - CO, UT, WY
During June, much of the region experienced below average precipitation and above average temperatures. Snowpack melted out by June 4 in Utah, June 9 in Colorado, and June 19 in Wyoming. Regional streamflow conditions are below to much below average. As of July 1, Colorado reservoirs are 49% full, Utah reservoirs are 66% full, and Wyoming reservoirs are 65% full. Regional drought coverage remained the same at 97%. Pacific Ocean temperatures transitioned to El Niño conditions in June and are expected to persist through winter 2026-27. NOAA seasonal forecasts suggest above average regional precipitation and temperatures during July through September.
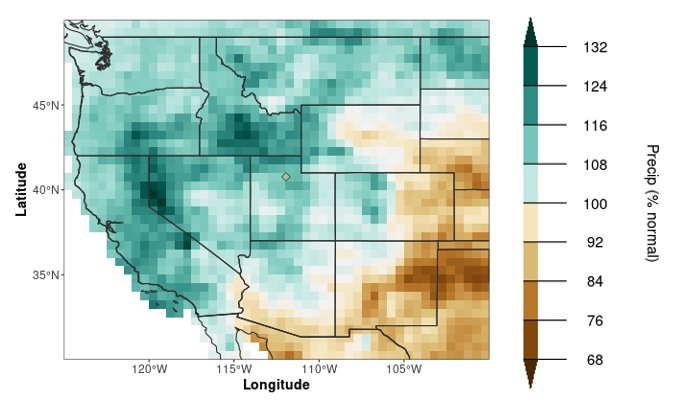
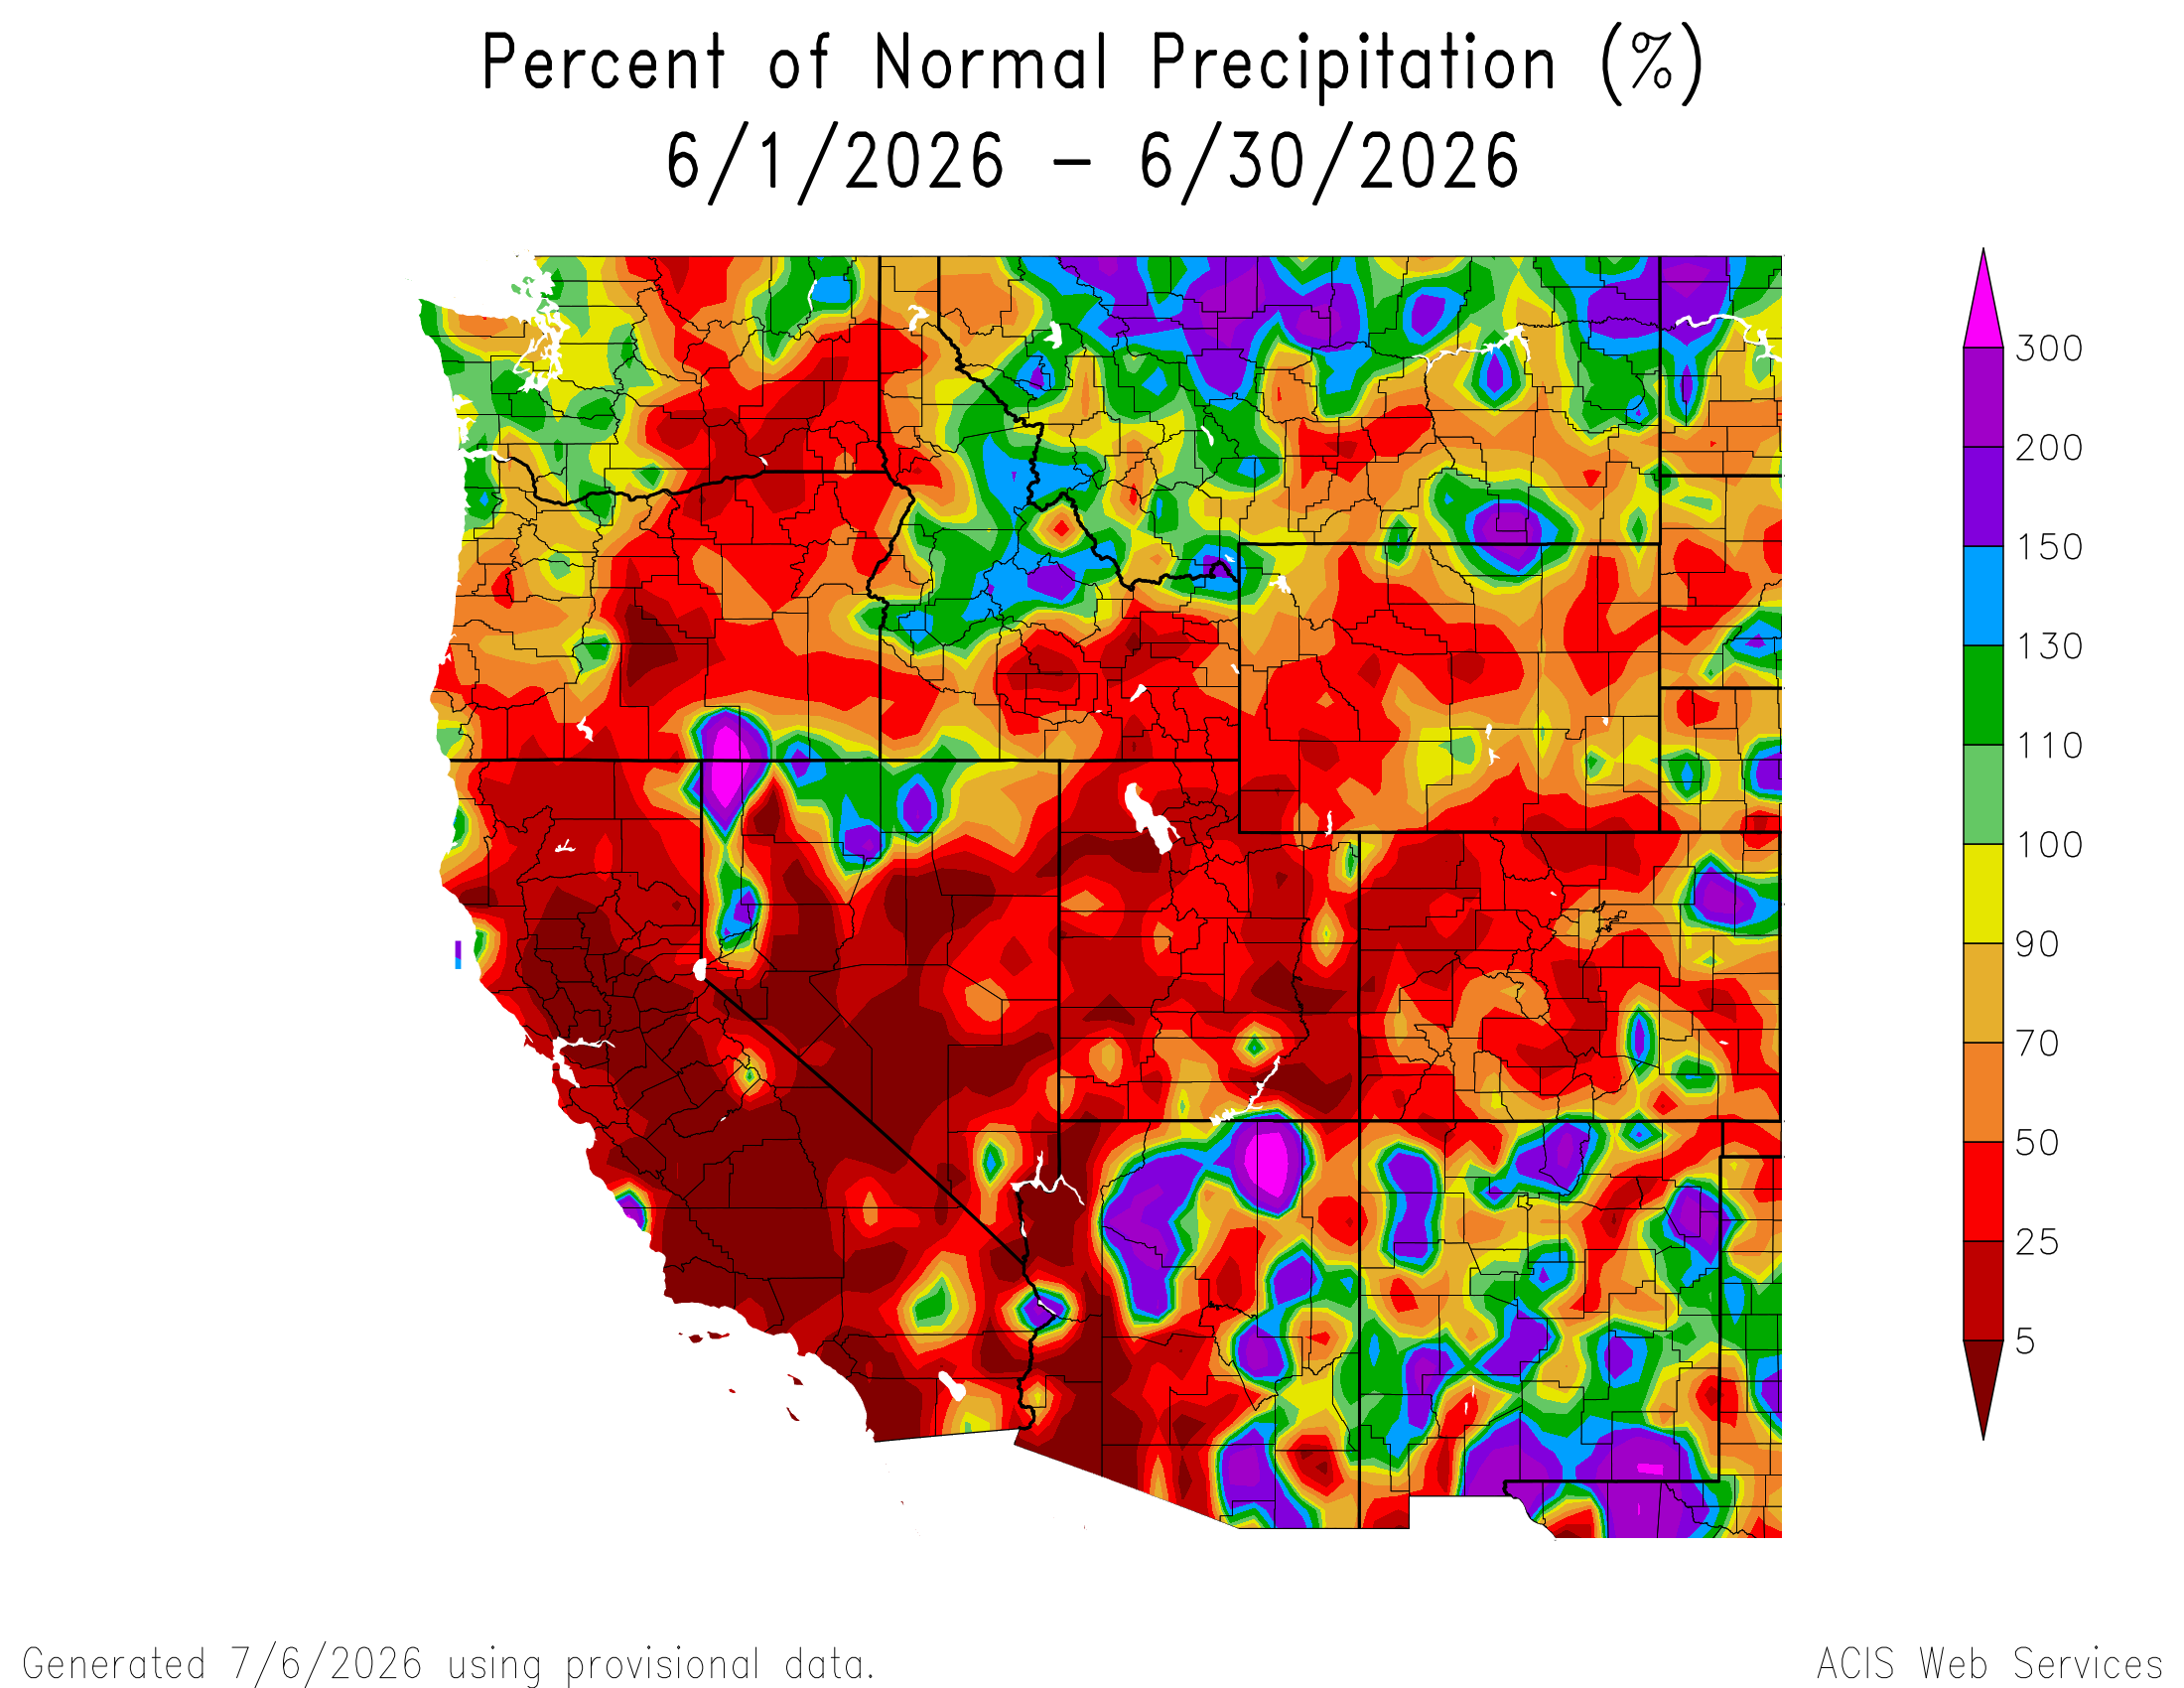
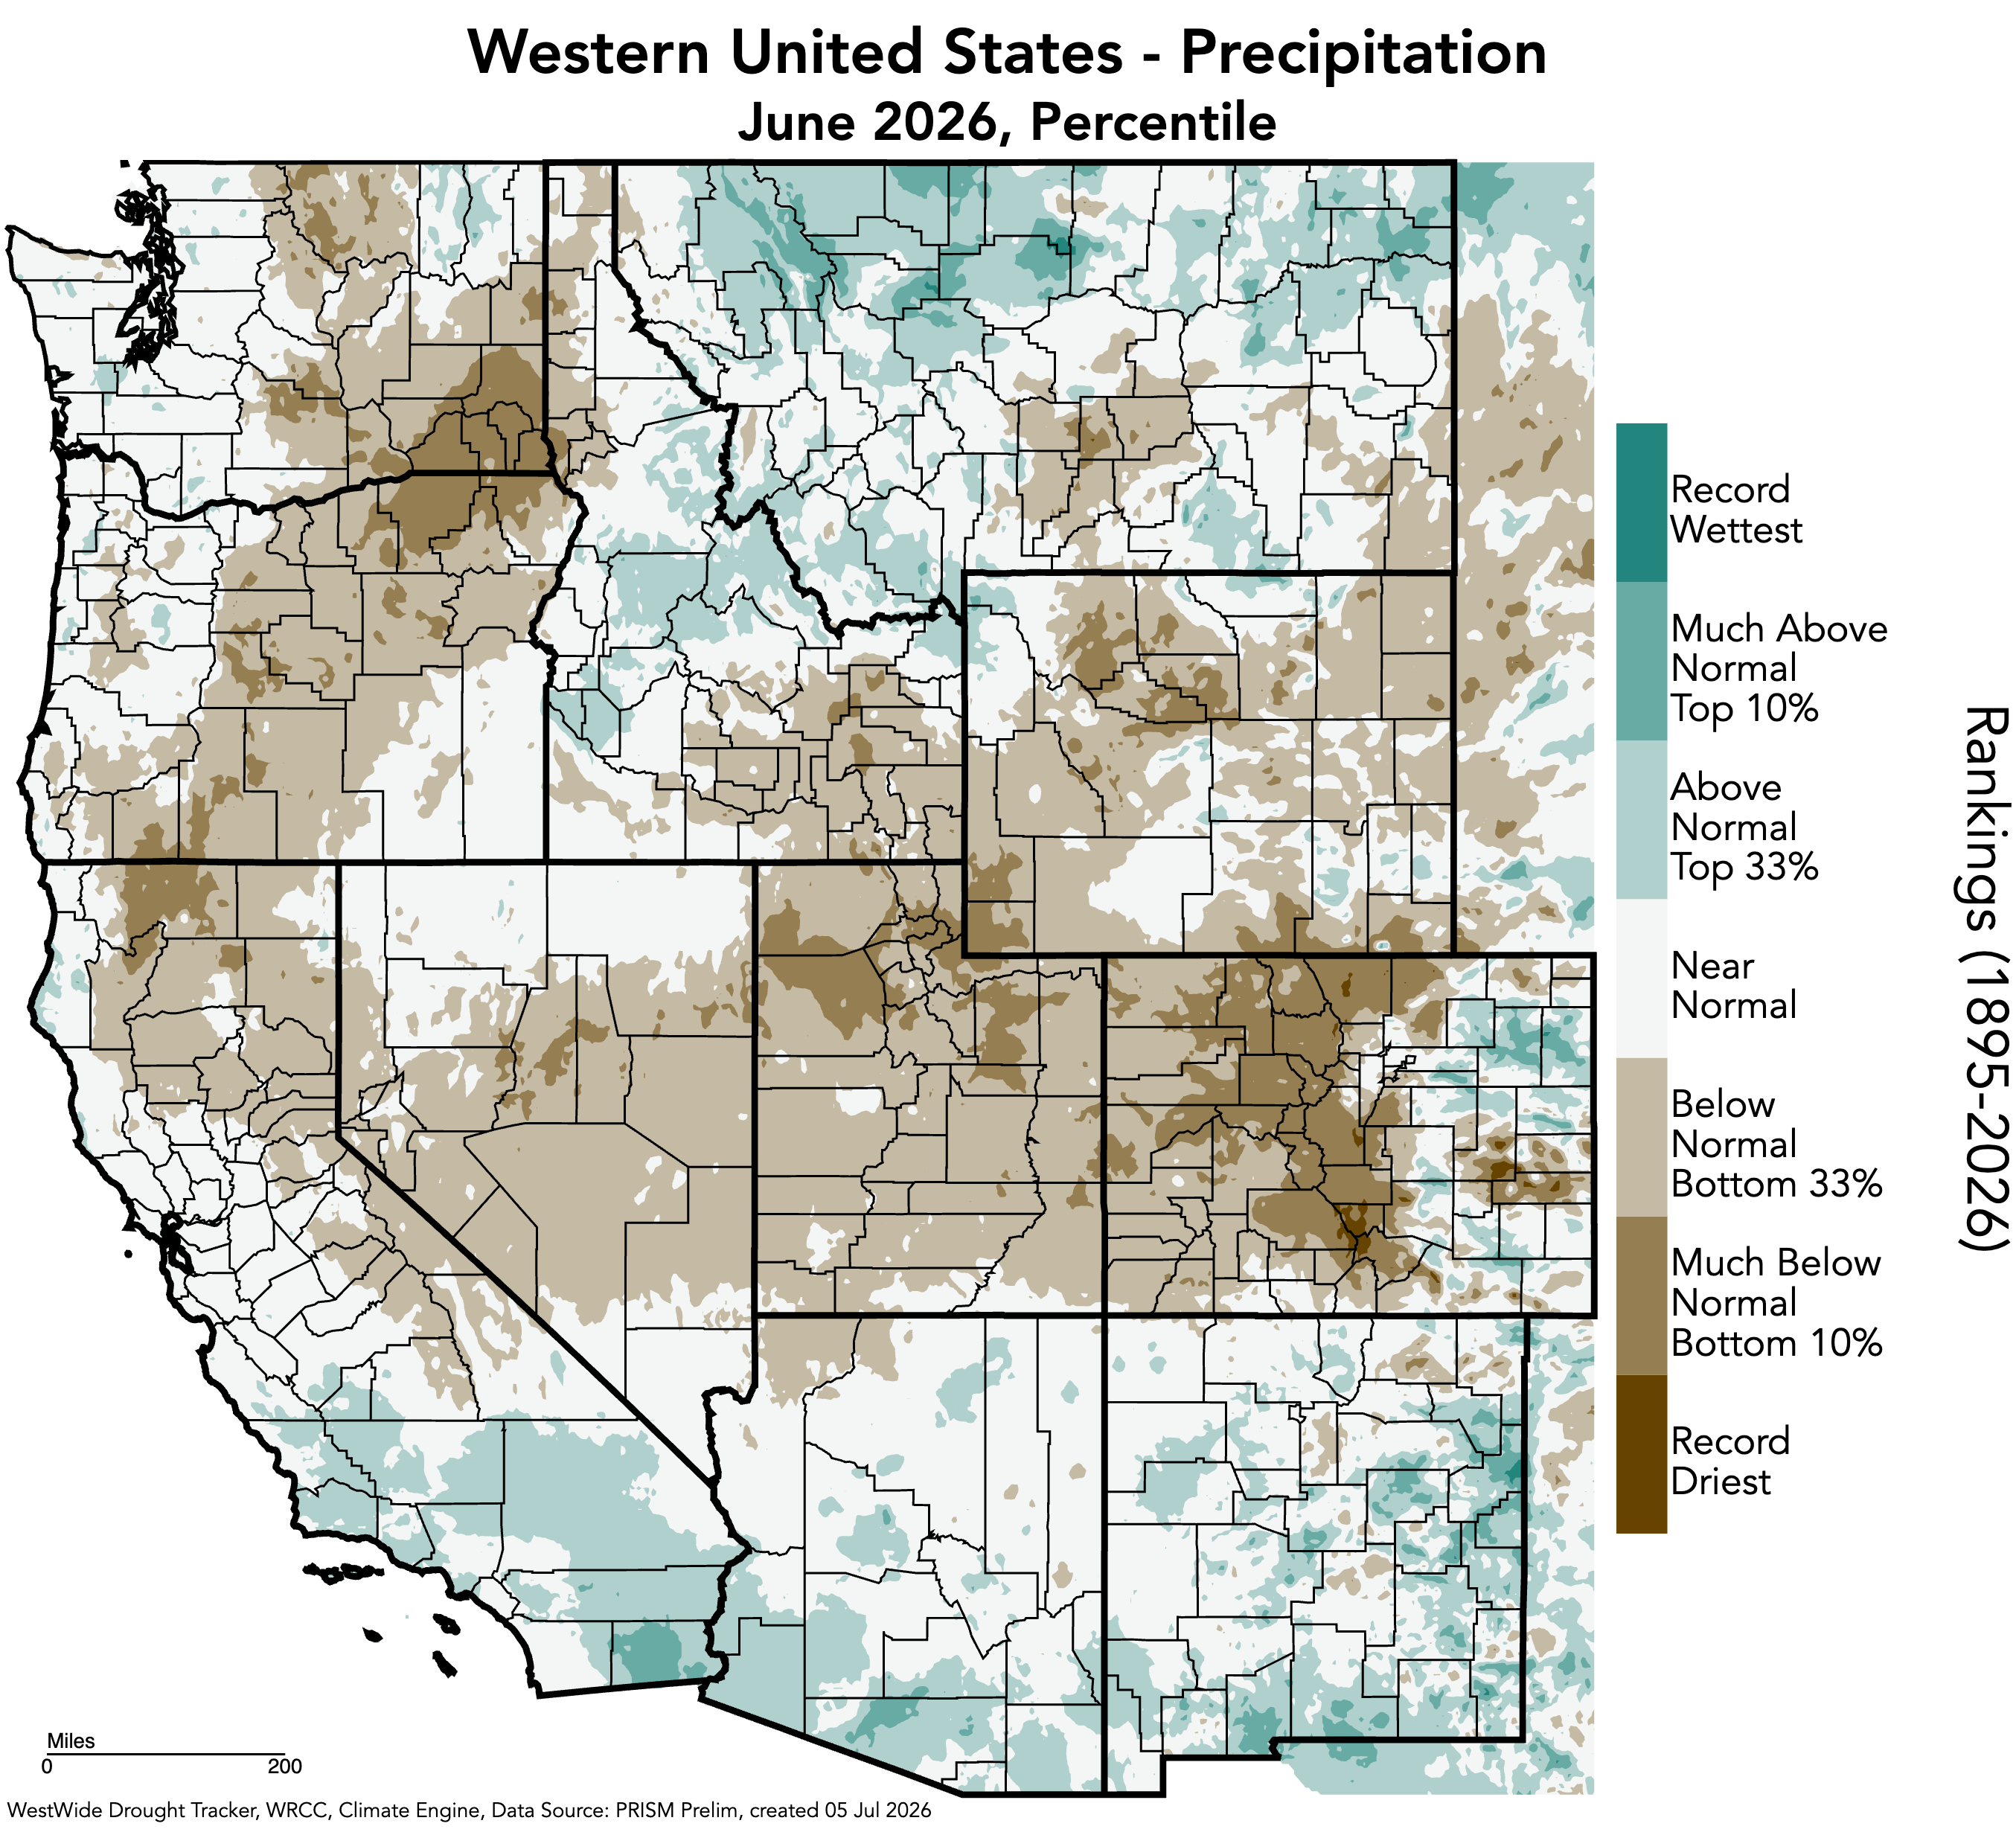
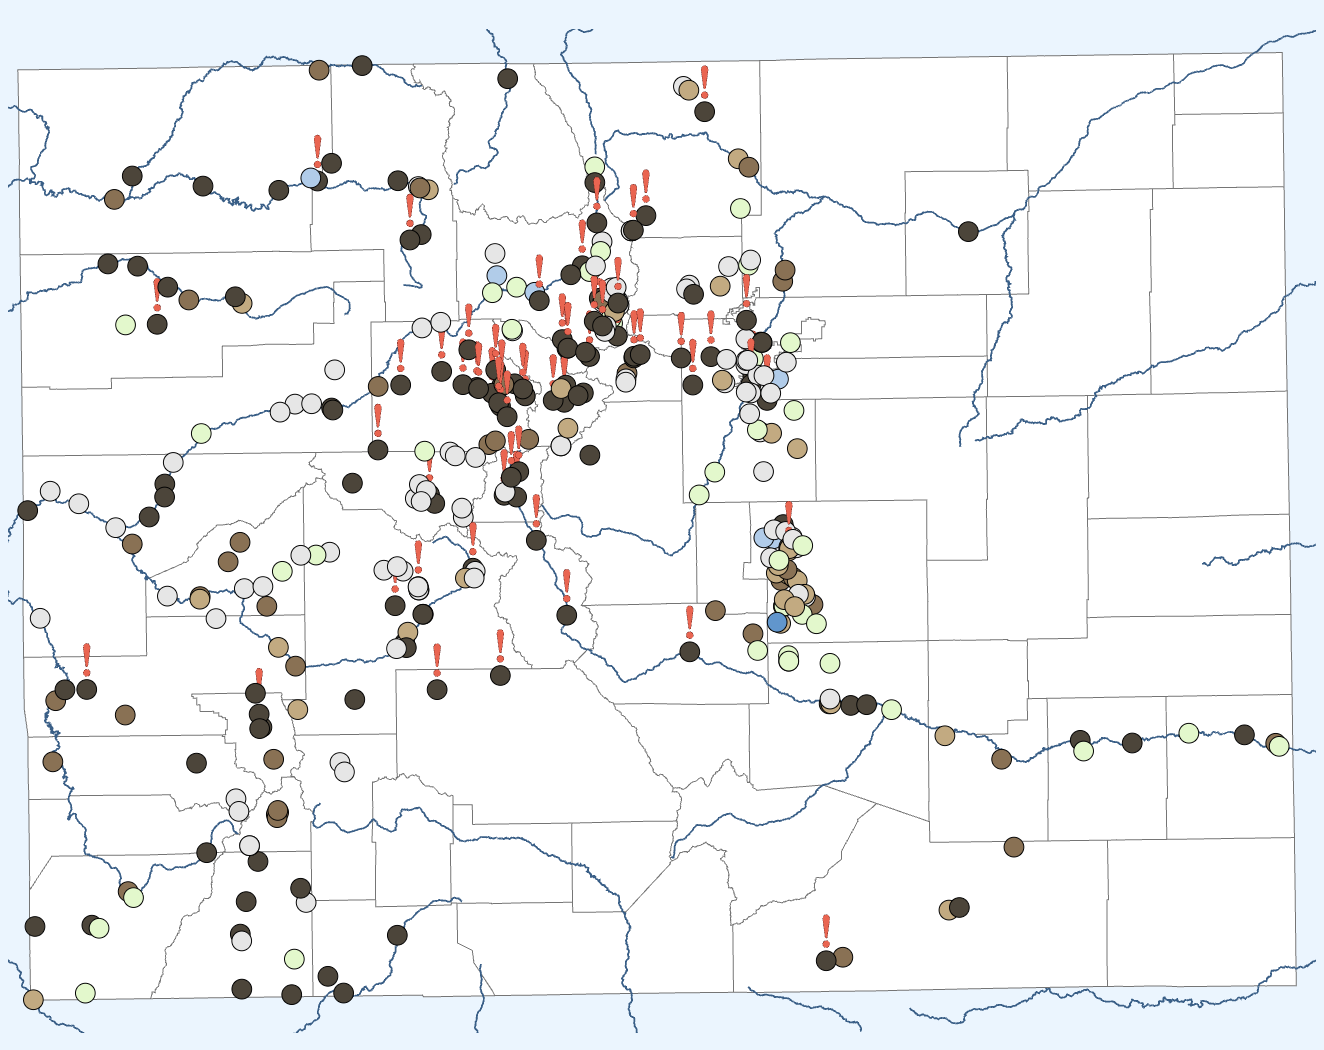
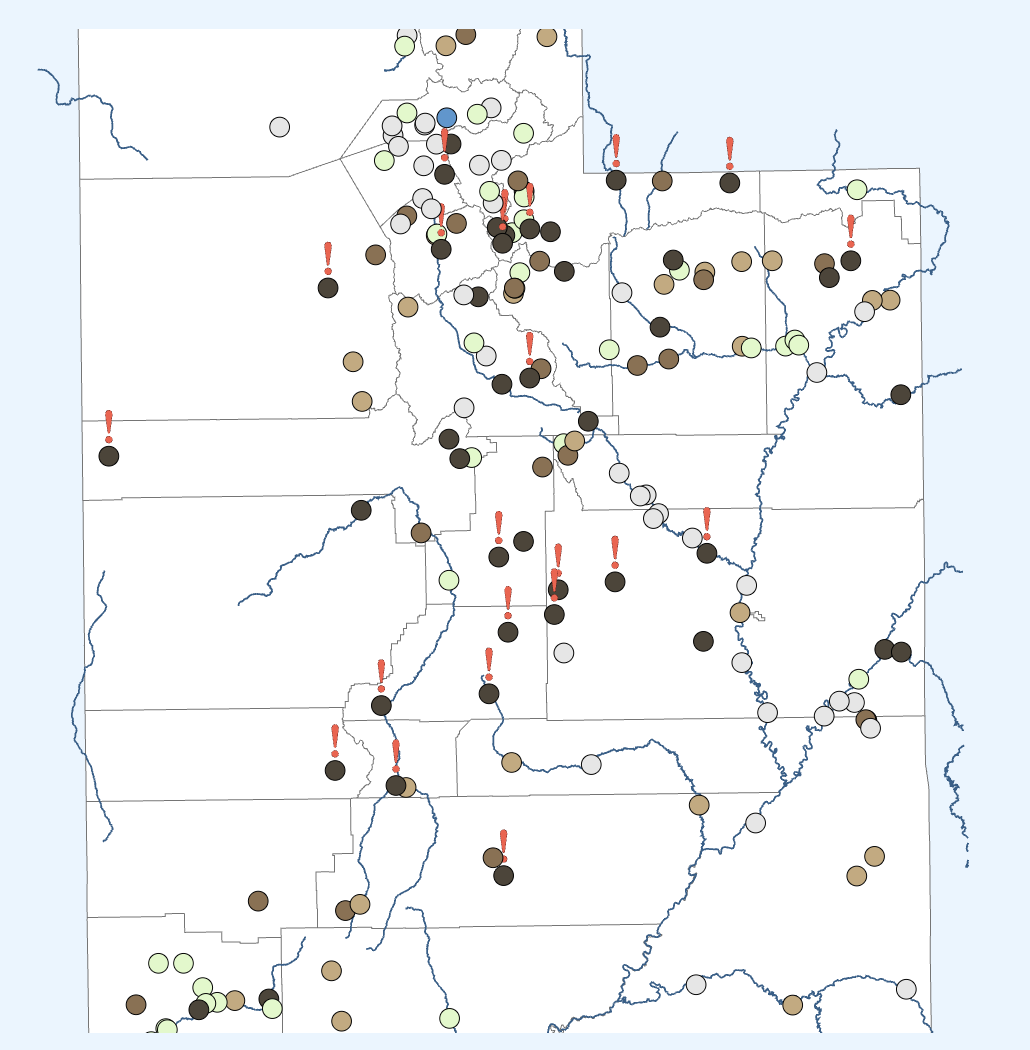
June precipitation was below average for most of the region, with Utah, western Colorado, and western Wyoming receiving less than 50% of average precipitation. Pockets of less than 5% of average precipitation occurred in Tooele, Millard, Beaver, Duchesne, Emery, Grand, Garfield, and San Juan Counties in Utah, and in Mesa County, Colorado. A few pockets of above average precipitation occurred in eastern Colorado and northern Wyoming. Record-dry conditions occurred in Larimer, Grand, Park, Custer, Saguache, Huerfano, Pueblo, Lincoln, and Kiowa Counties in Colorado.
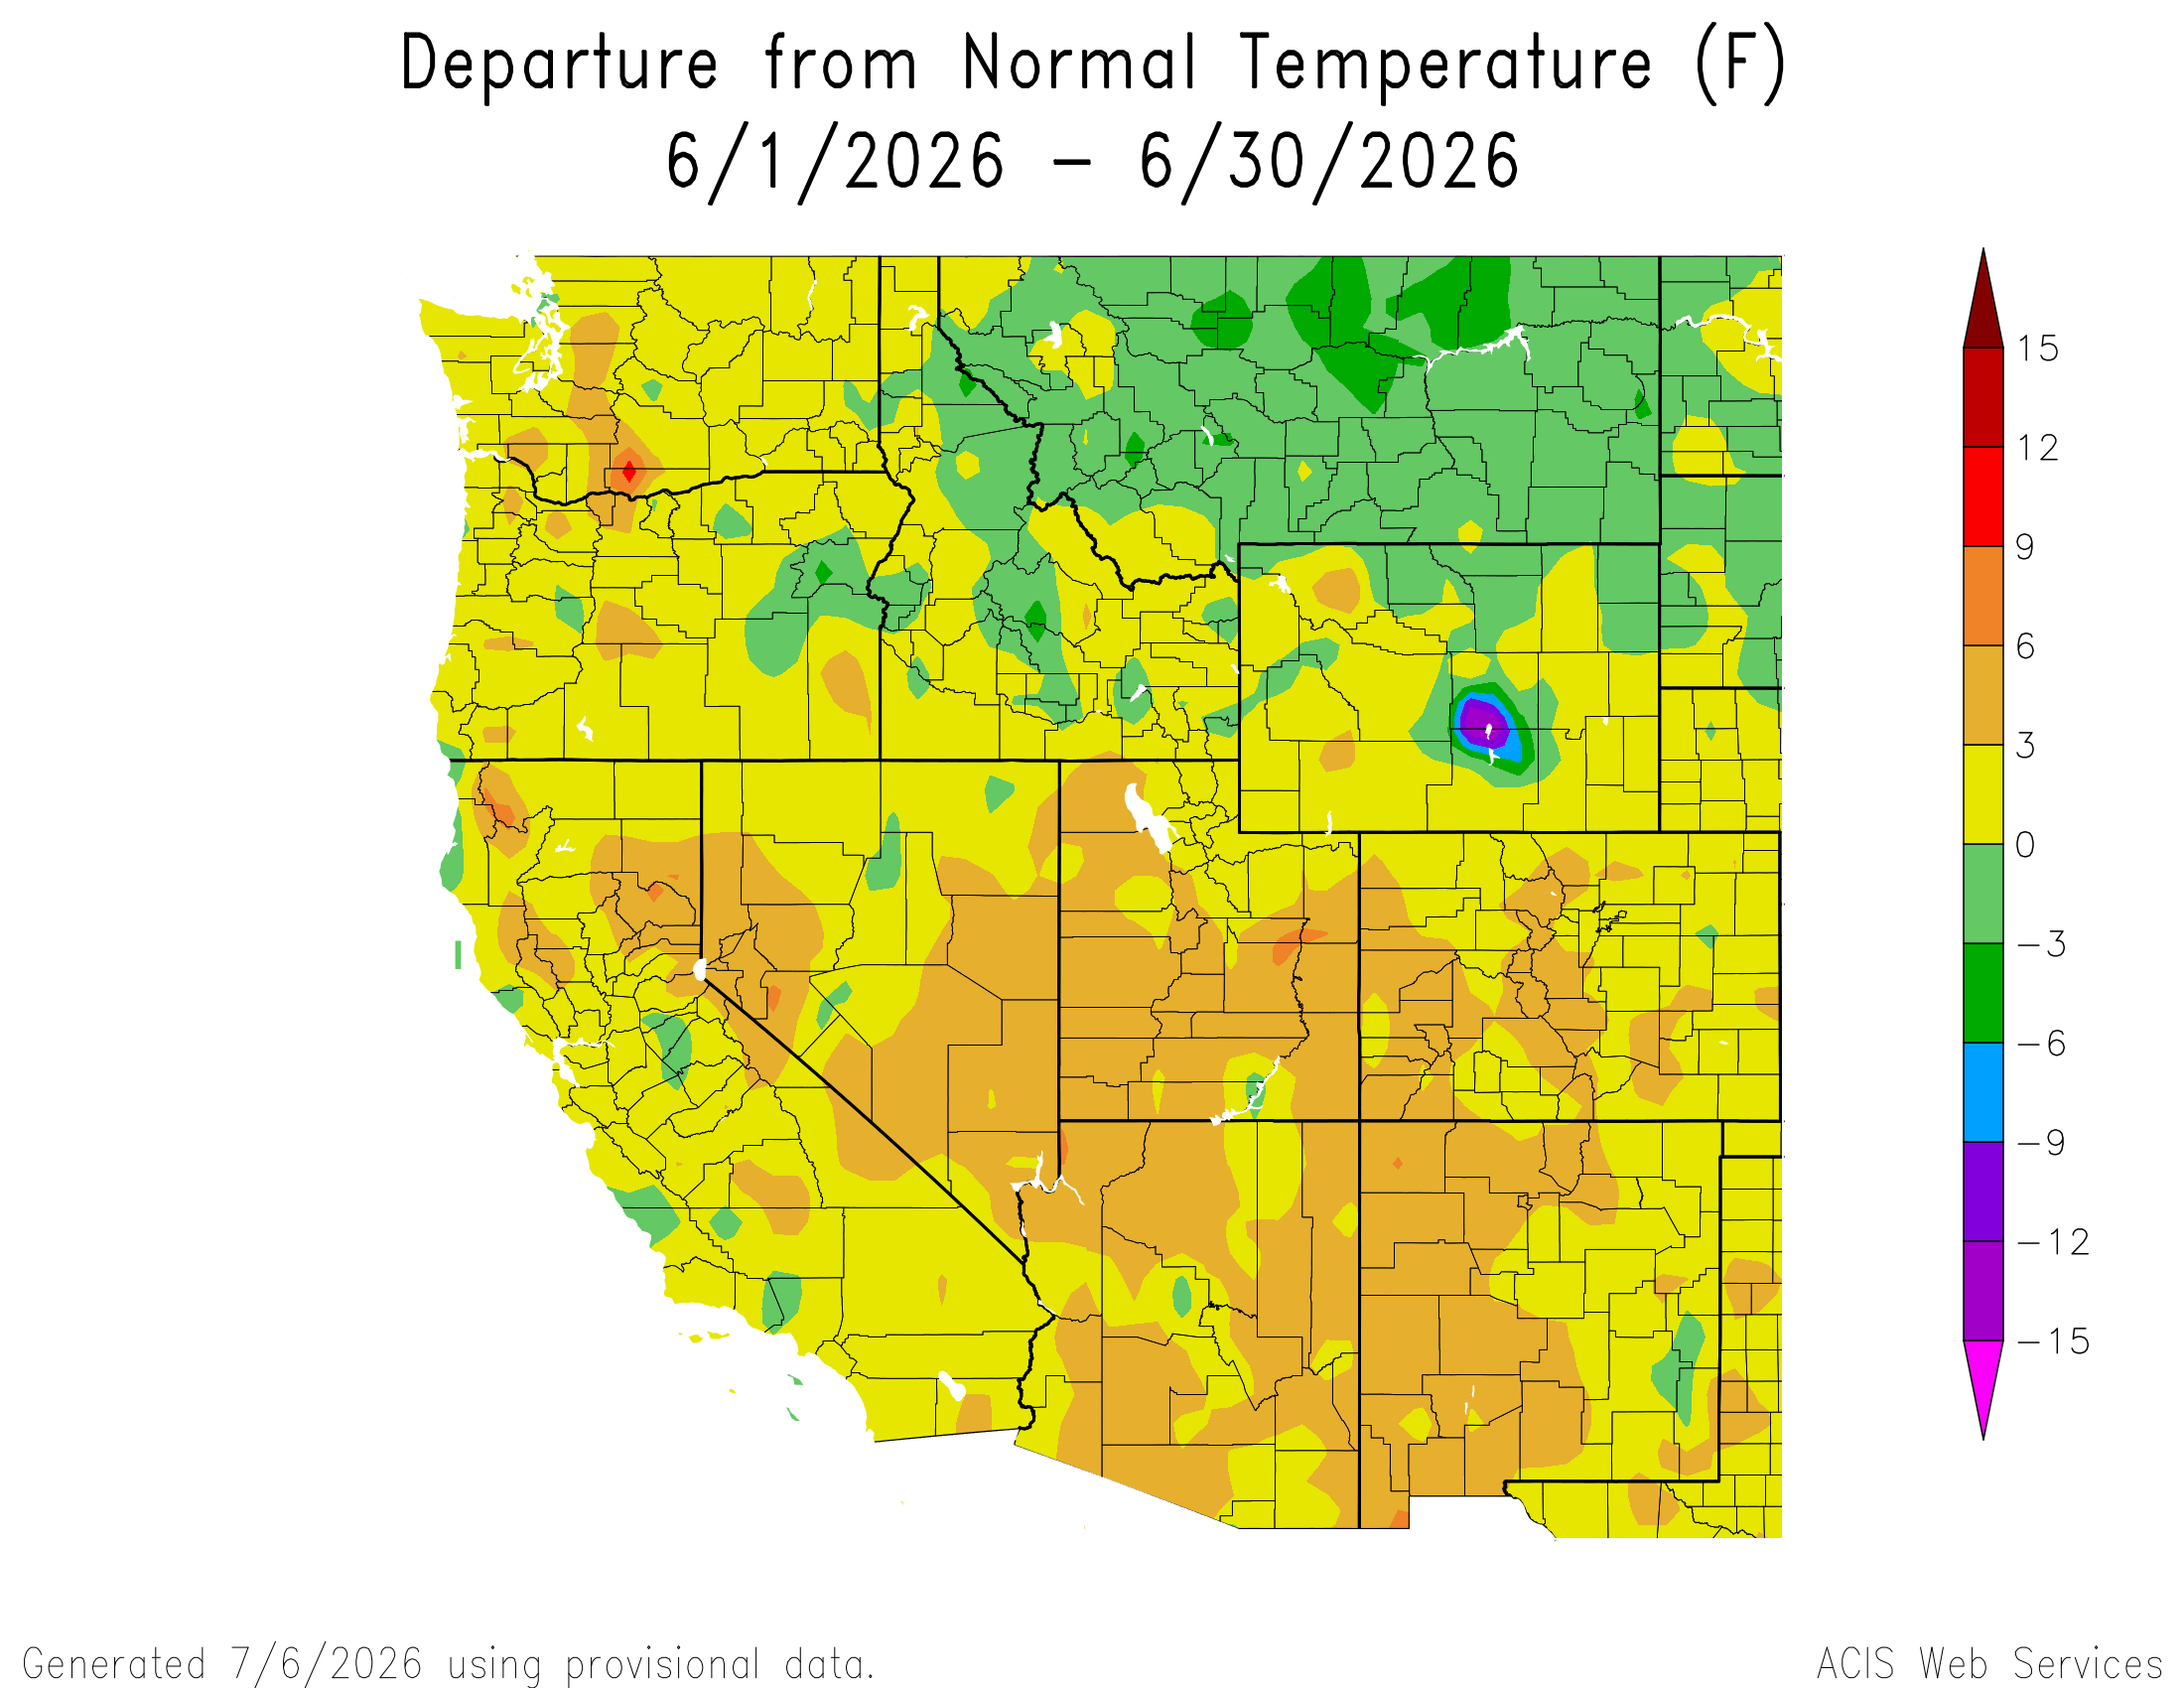
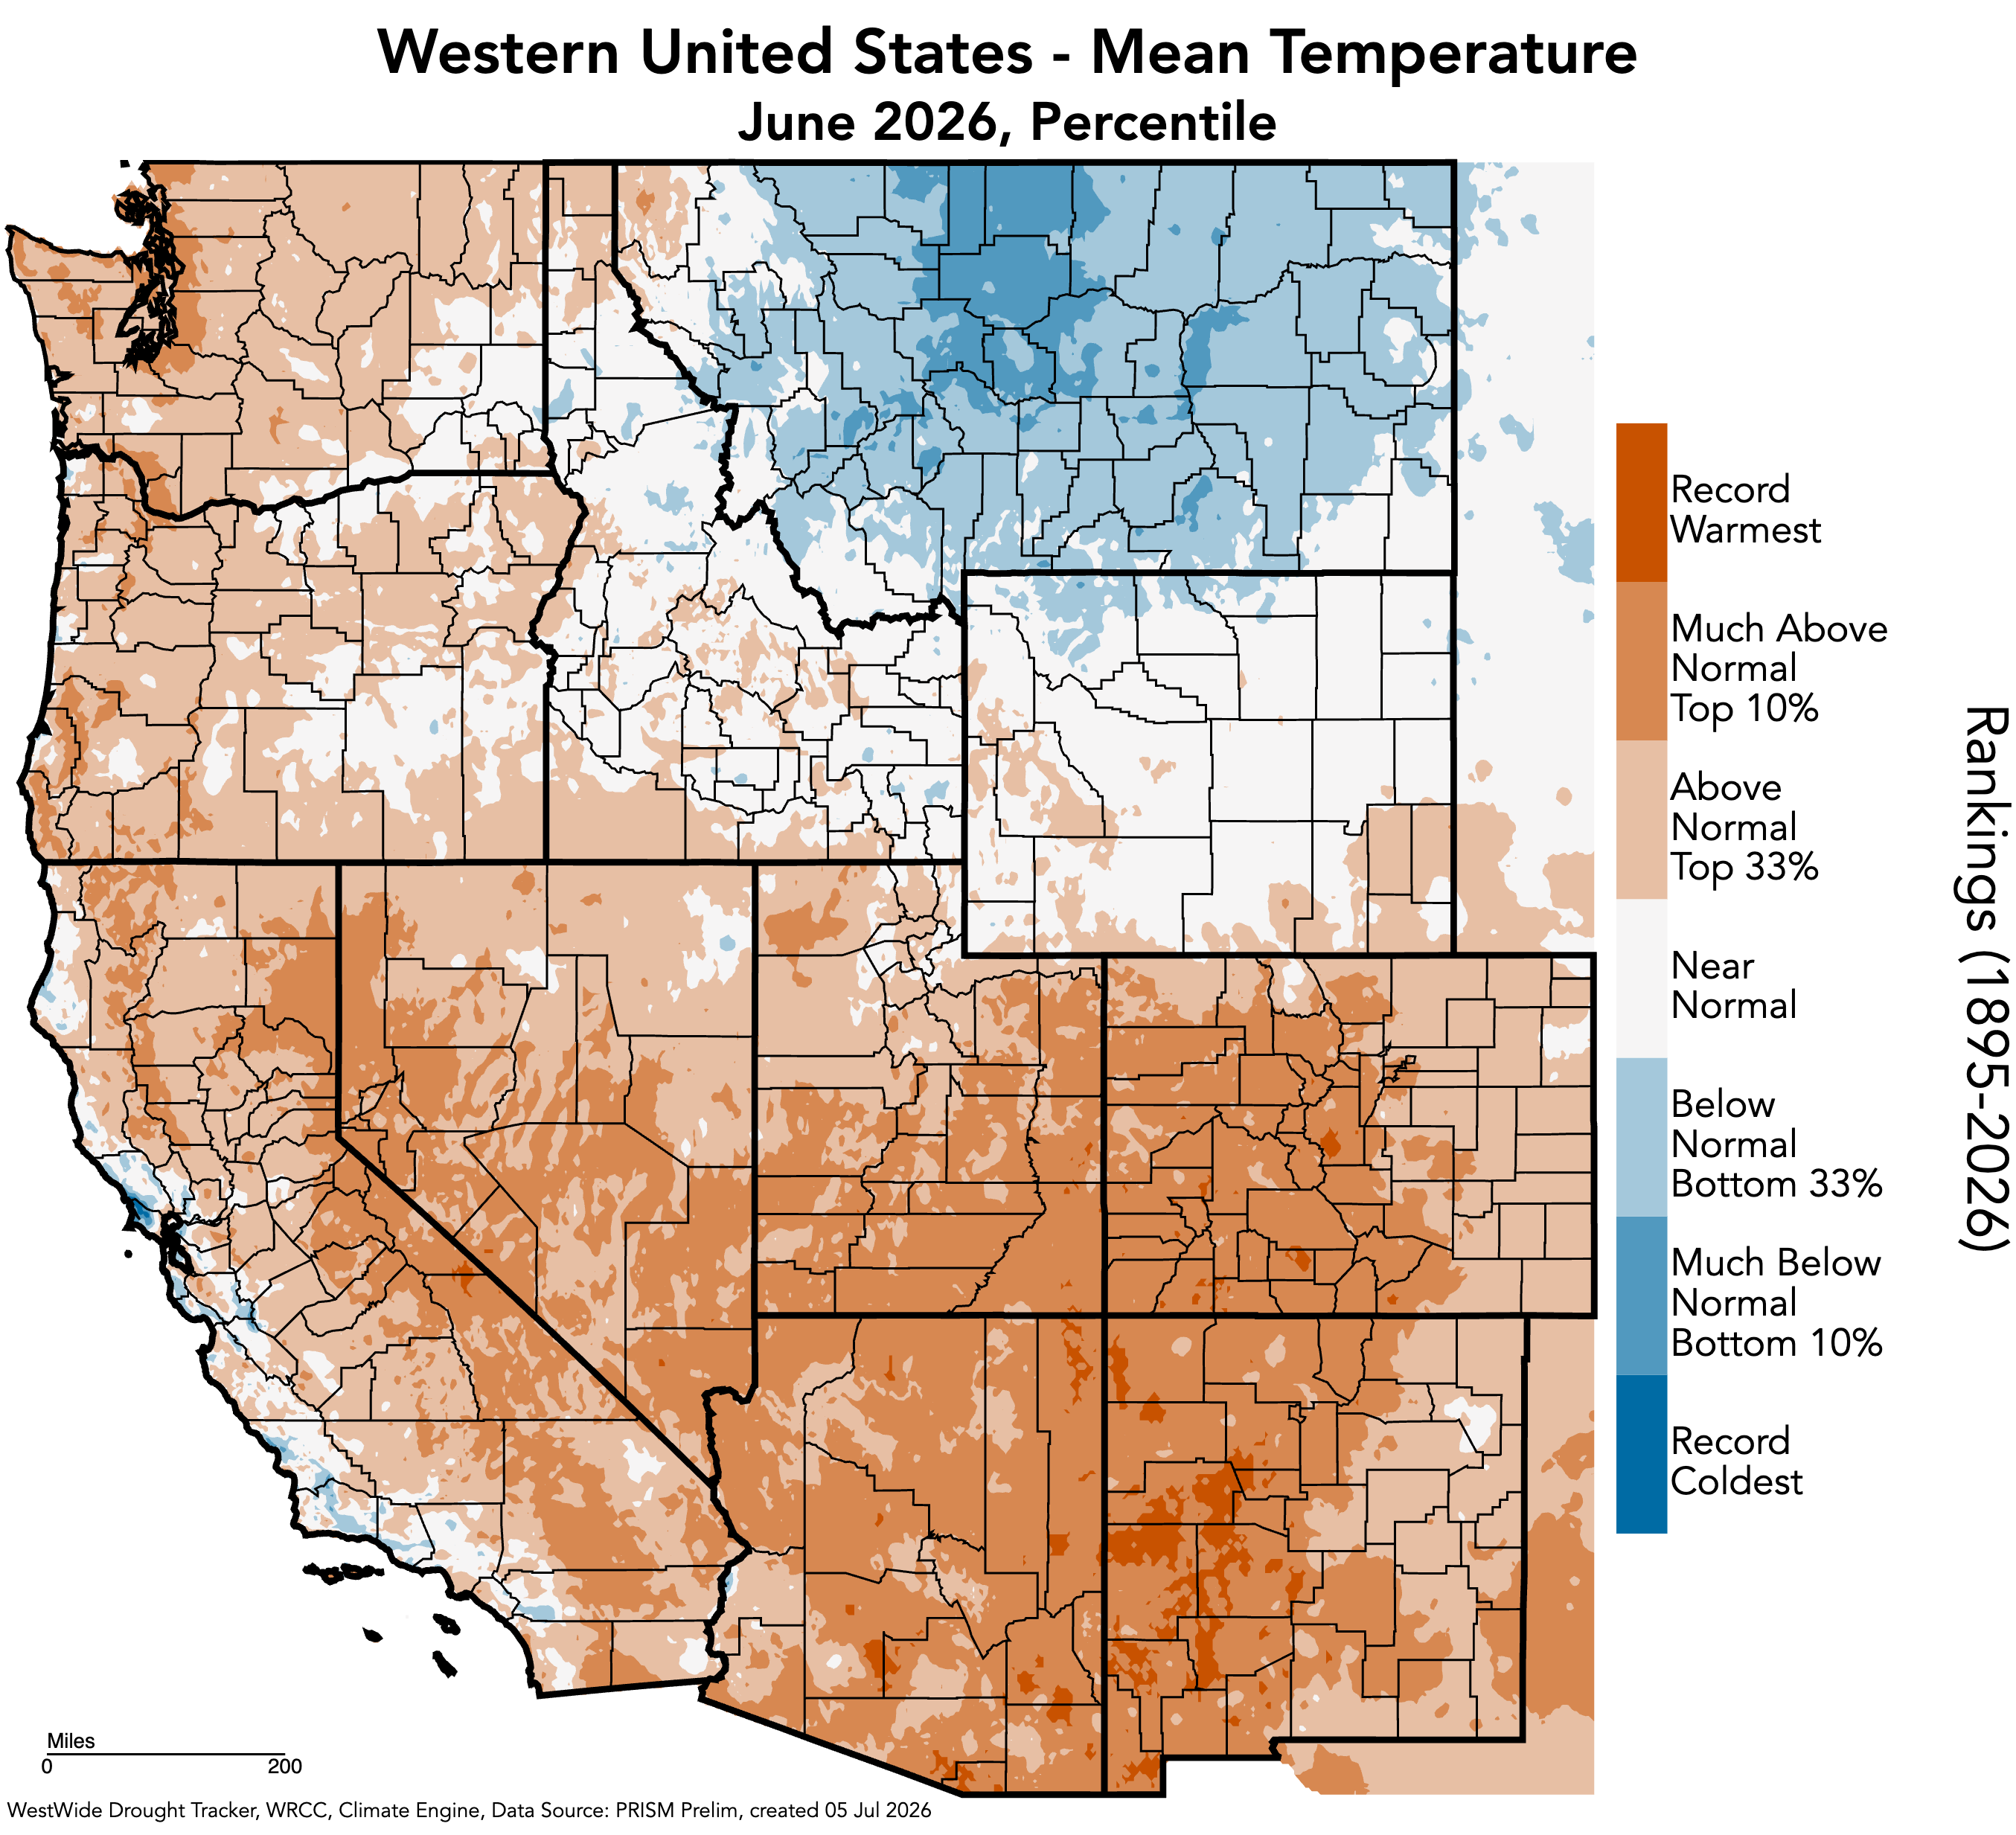
June temperatures were up to 3 °F above average in eastern Colorado, southern Wyoming, and northeastern Utah, while temperatures were up to 3 °F below average in northern and central Wyoming. Temperatures were 3-6 °F above average for much of Utah and western Colorado, with small pockets of these temperatures in eastern Colorado and western Wyoming. Record-warm temperatures occurred in southwestern Colorado and southeastern Utah.
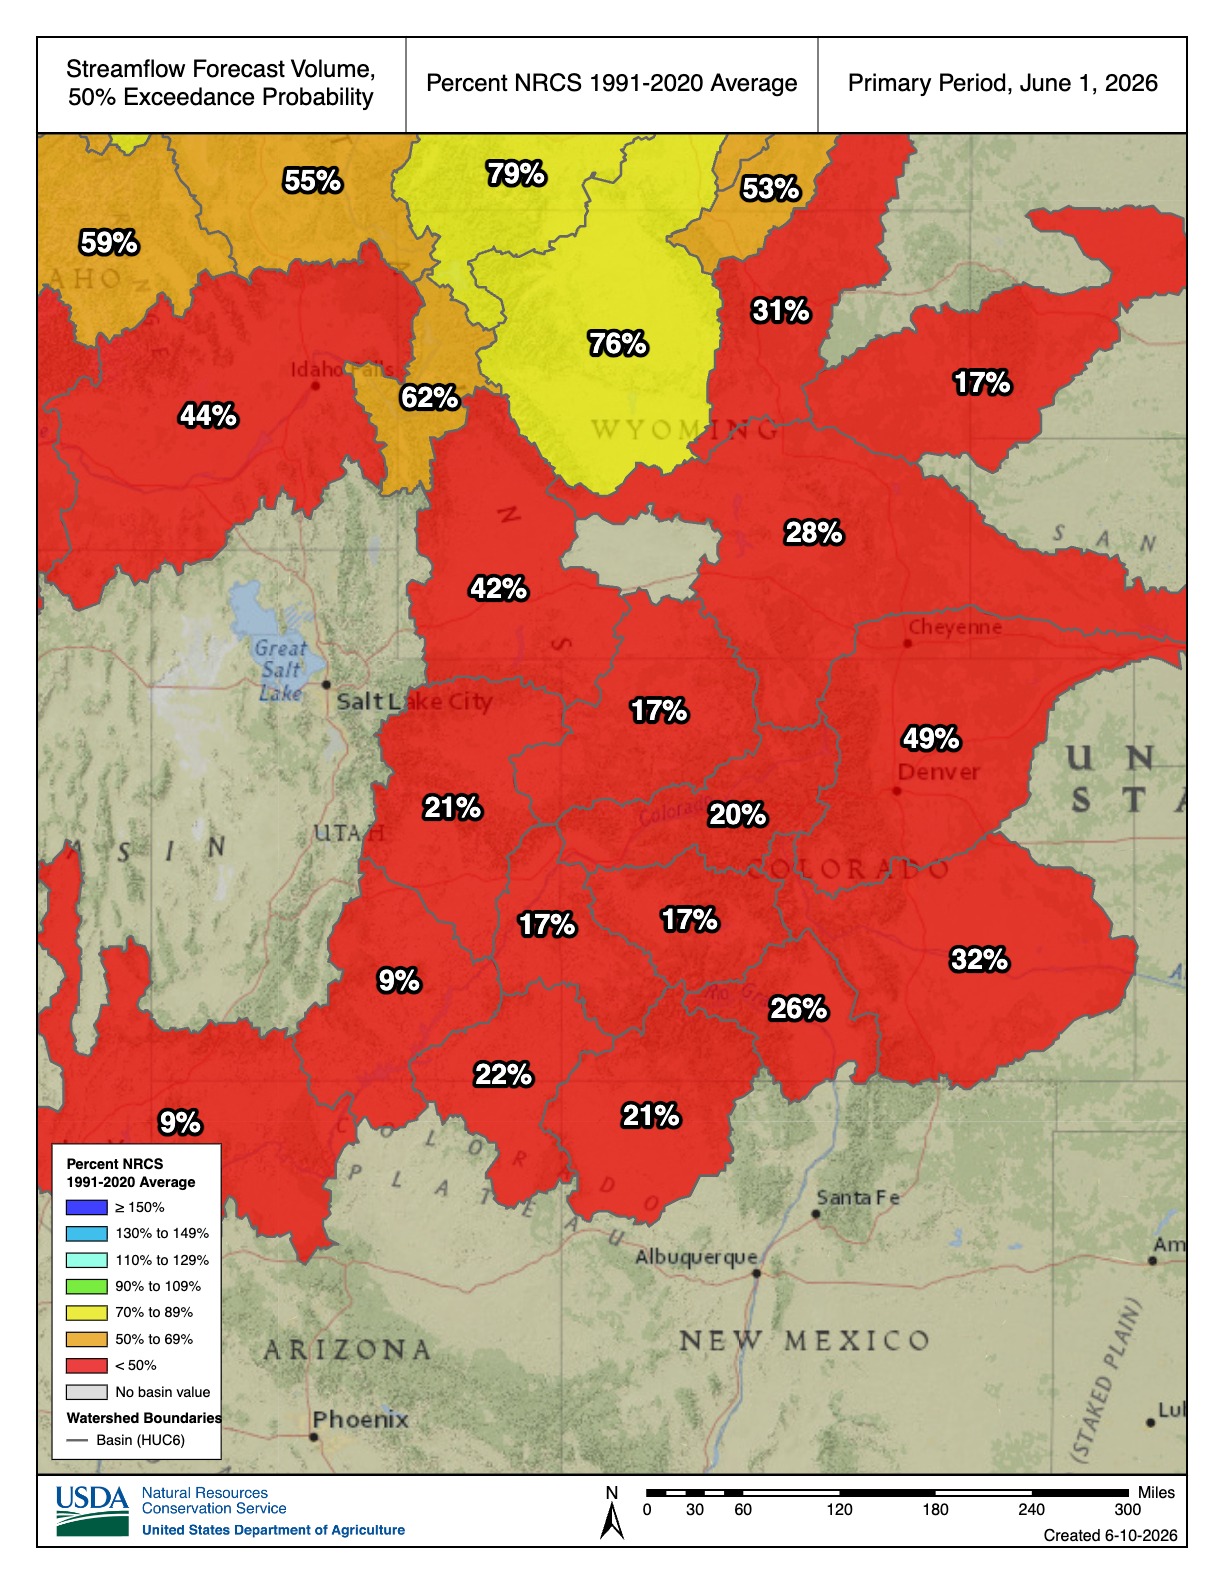
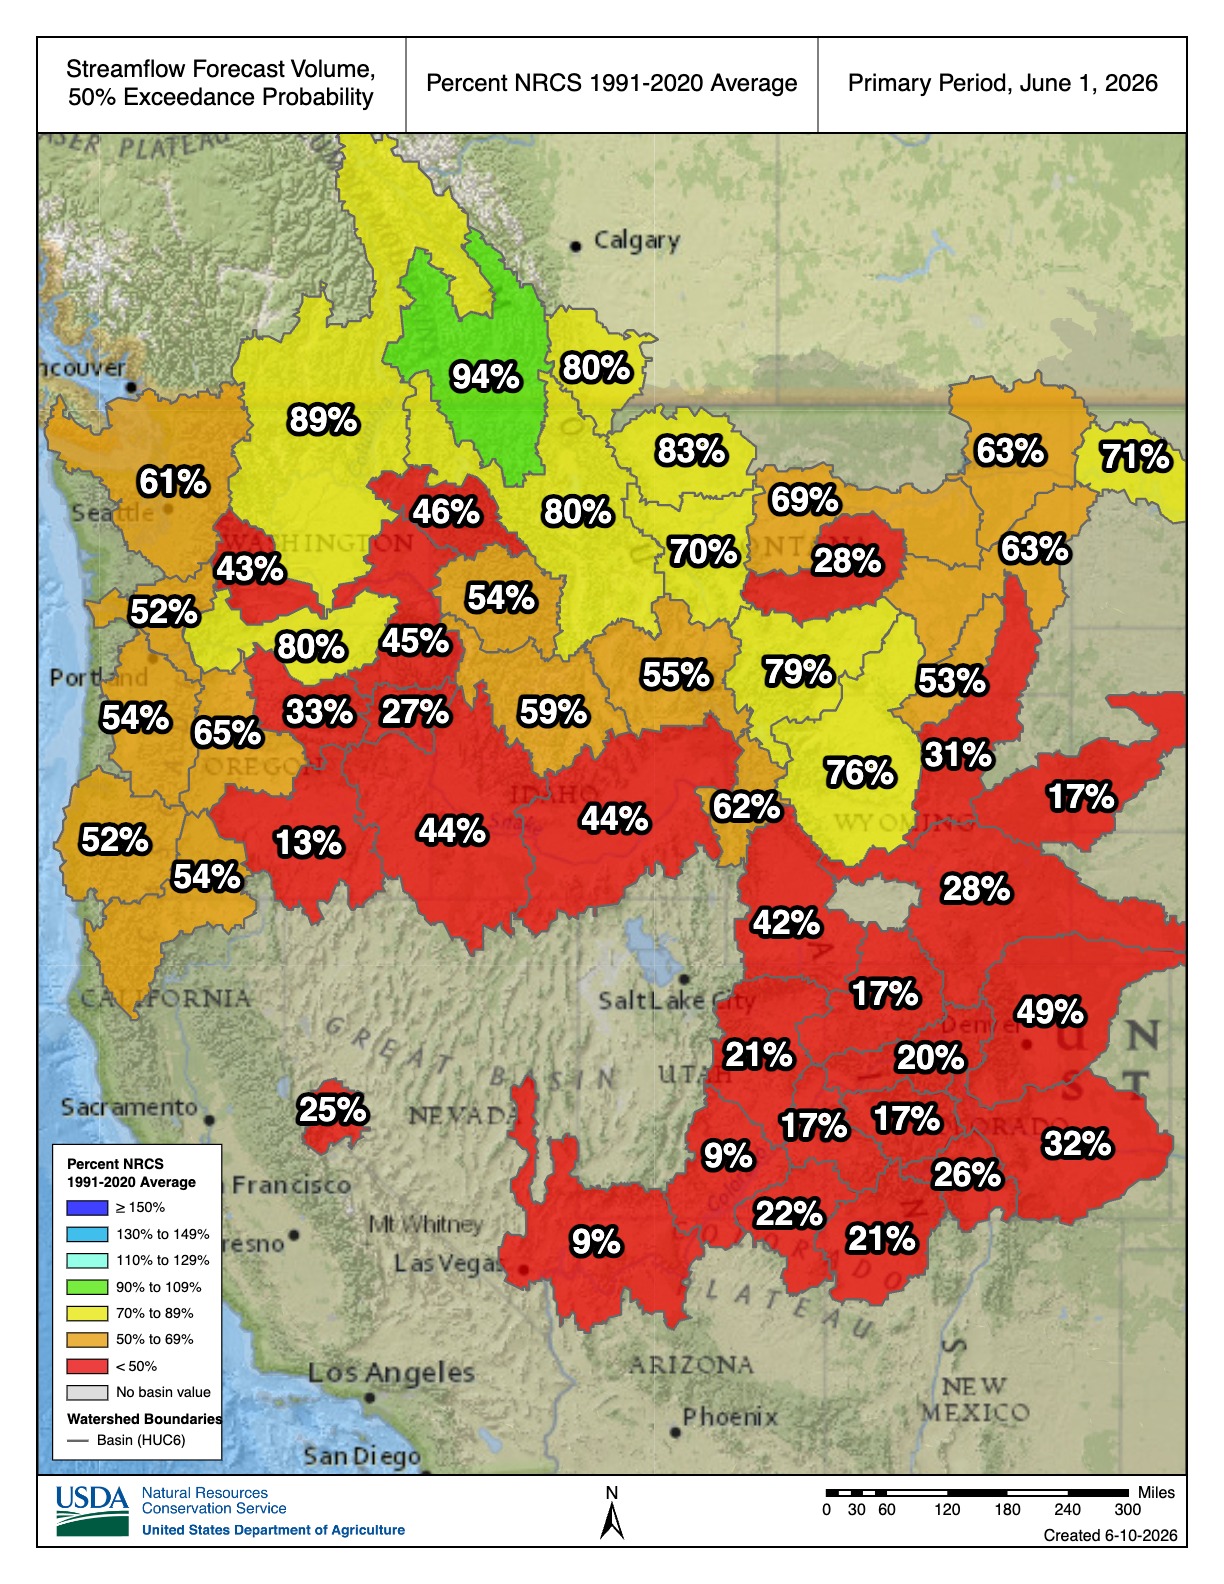
Regional streamflow conditions are much below average, with extremely below average streamflow at many sites throughout the Upper Colorado River and Great Basins. Extremely below average streamflow conditions for these sites mean that streamflow is below the lowest daily average ever recorded for this day of the year (July 9).
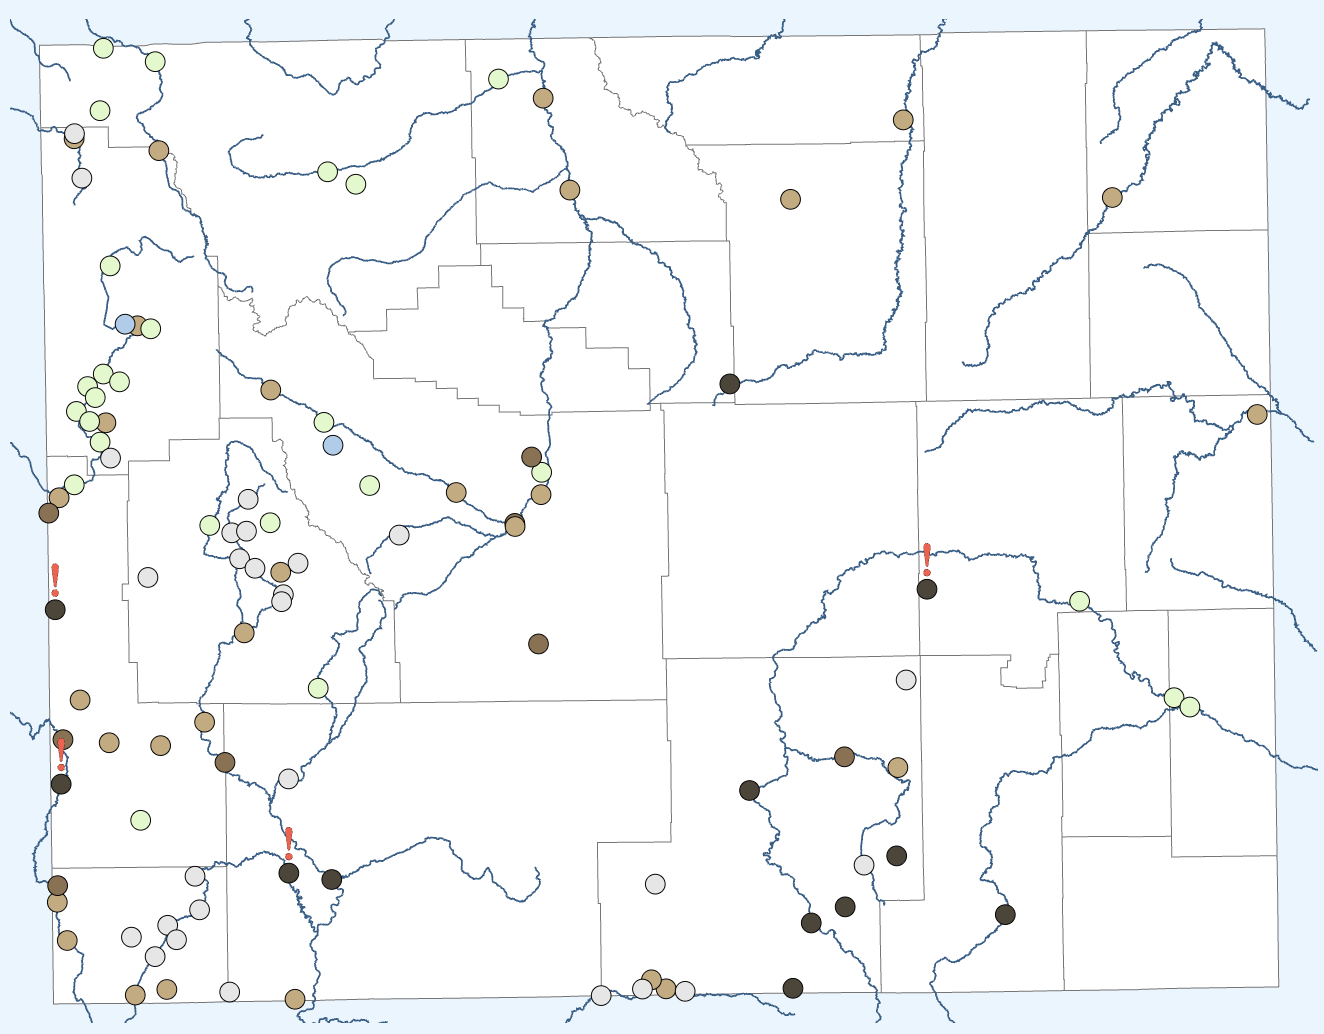

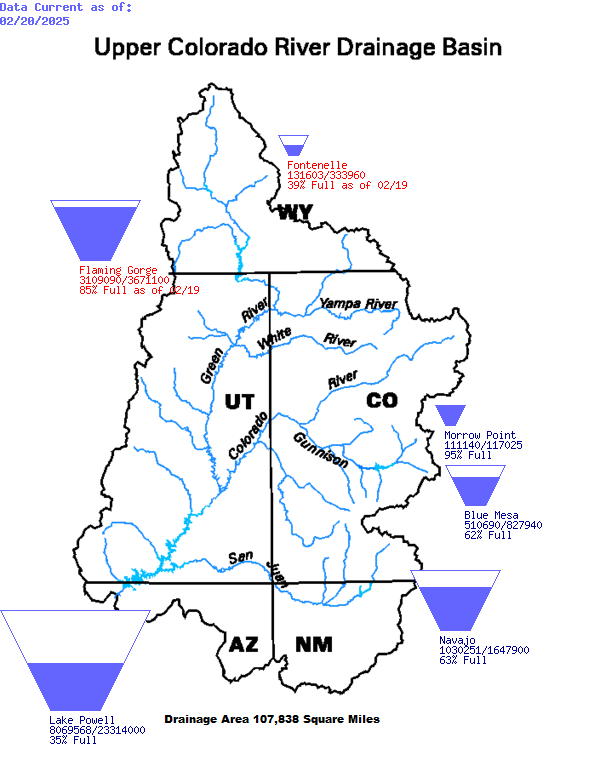
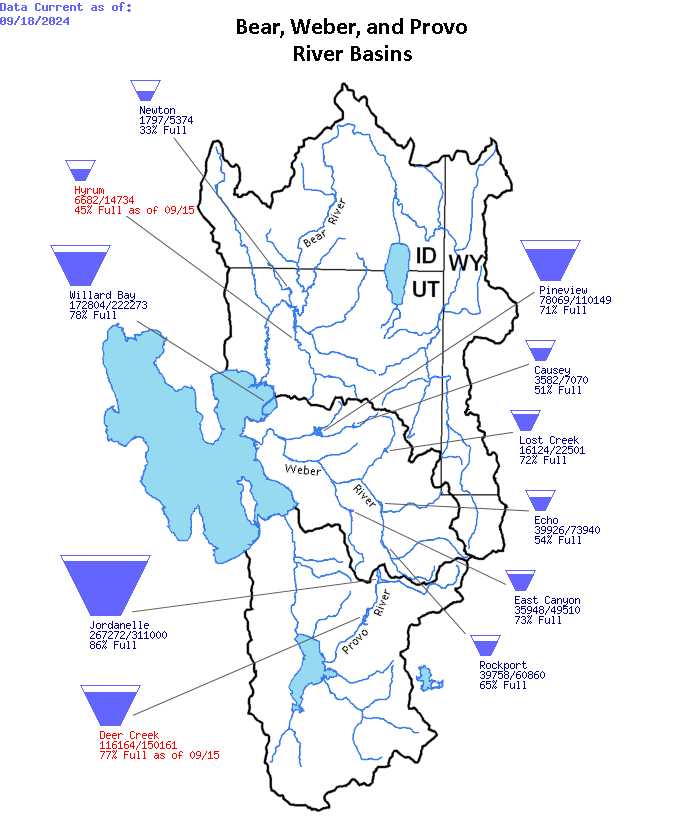
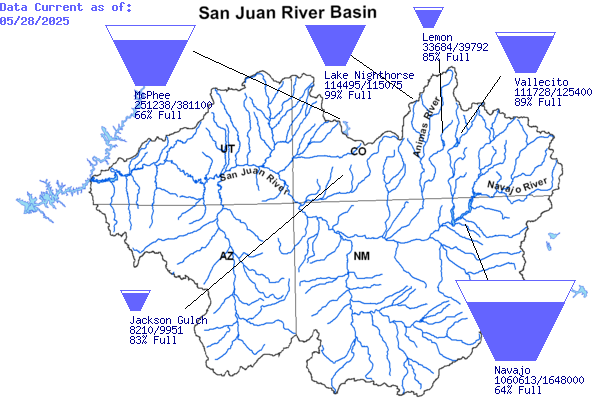
As of July 1, Colorado reservoirs are 49% full and at 64% of median capacity, Utah reservoirs are 66% full and at 83% of median capacity, and Wyoming reservoirs are 65% full and at 77% of median capacity. Reservoirs at 50% or less capacity include McPhee (49%), Blue Mesa (35%), and Green Mountain (29%) in Colorado; Echo (50%) and Lake Powell (24%) in Utah; and Seminoe (37%) and Pathfinder (27%) in Wyoming.
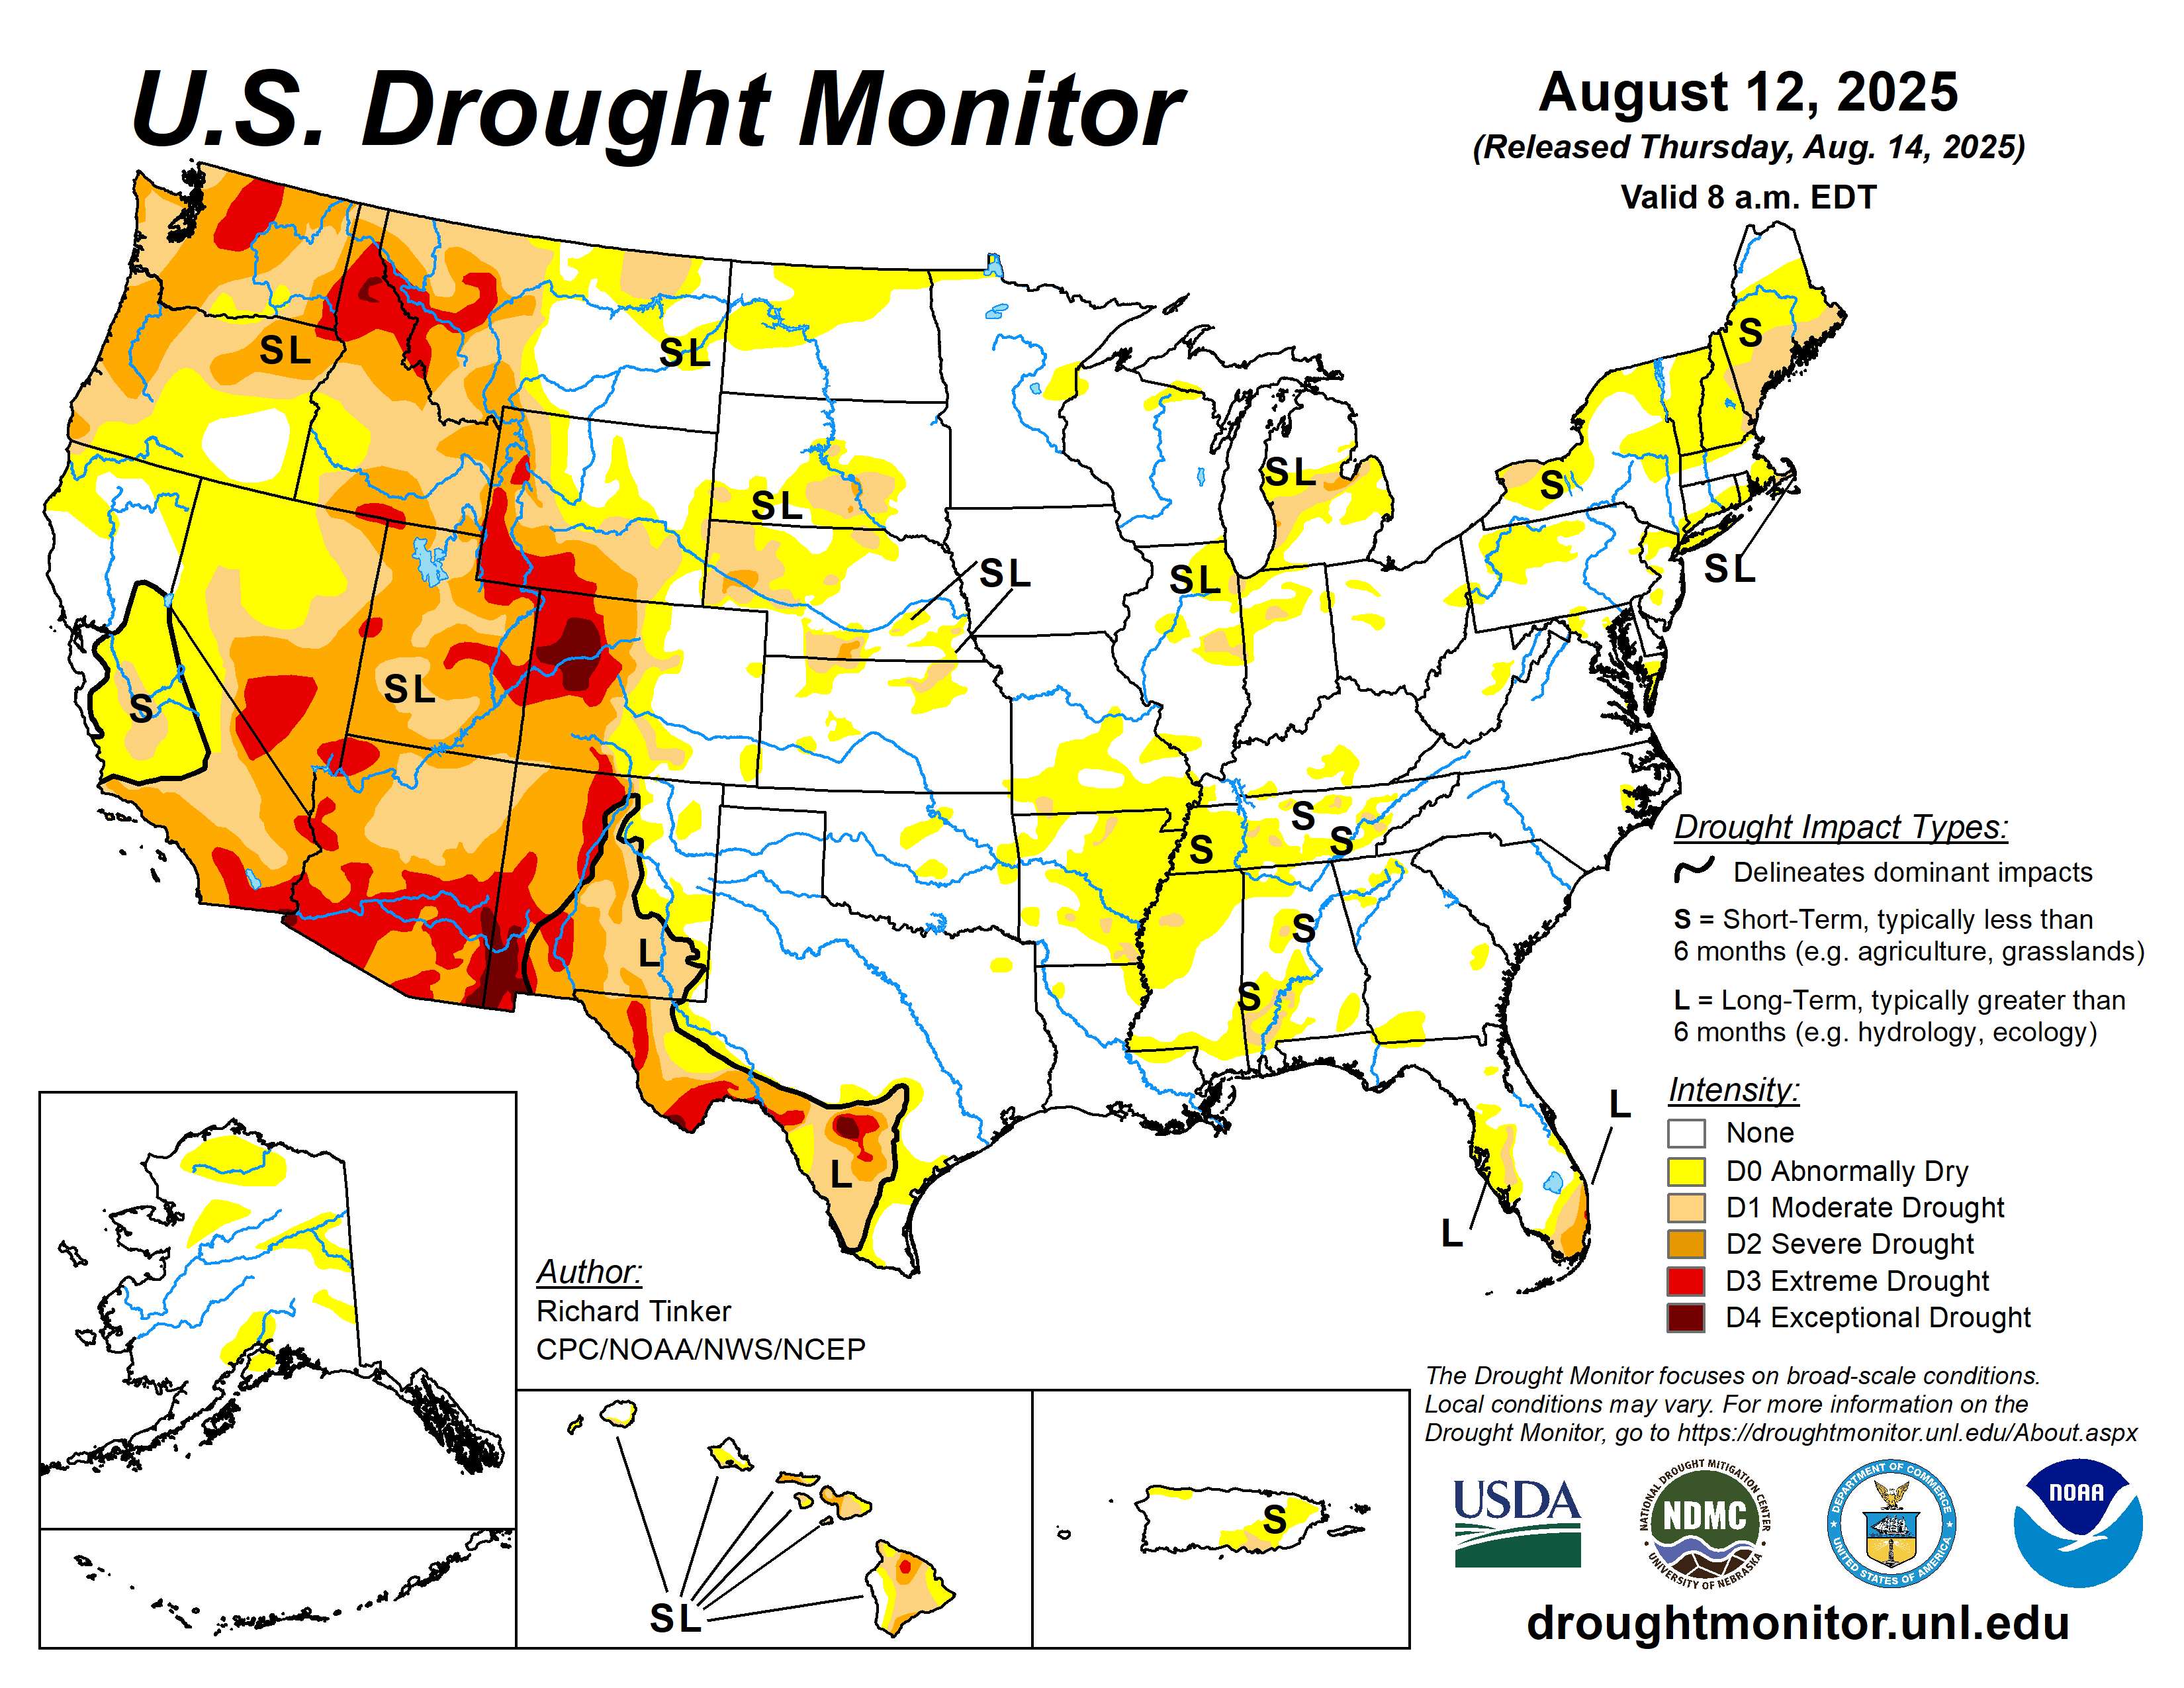
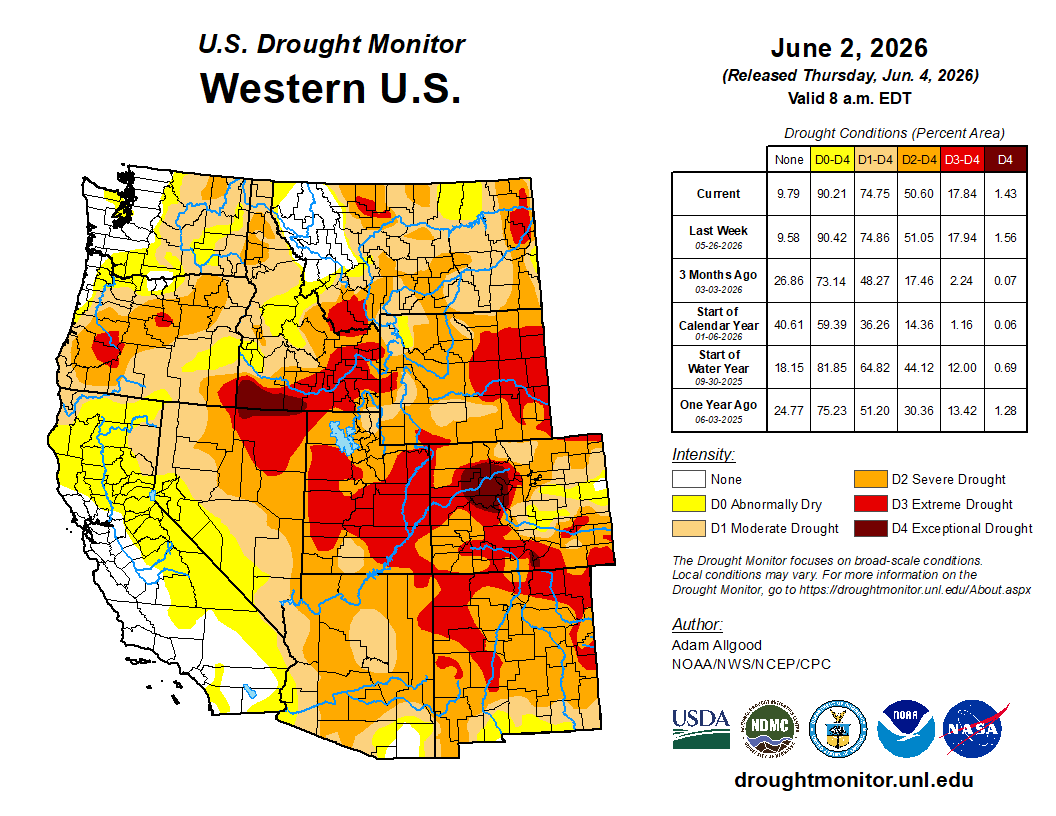
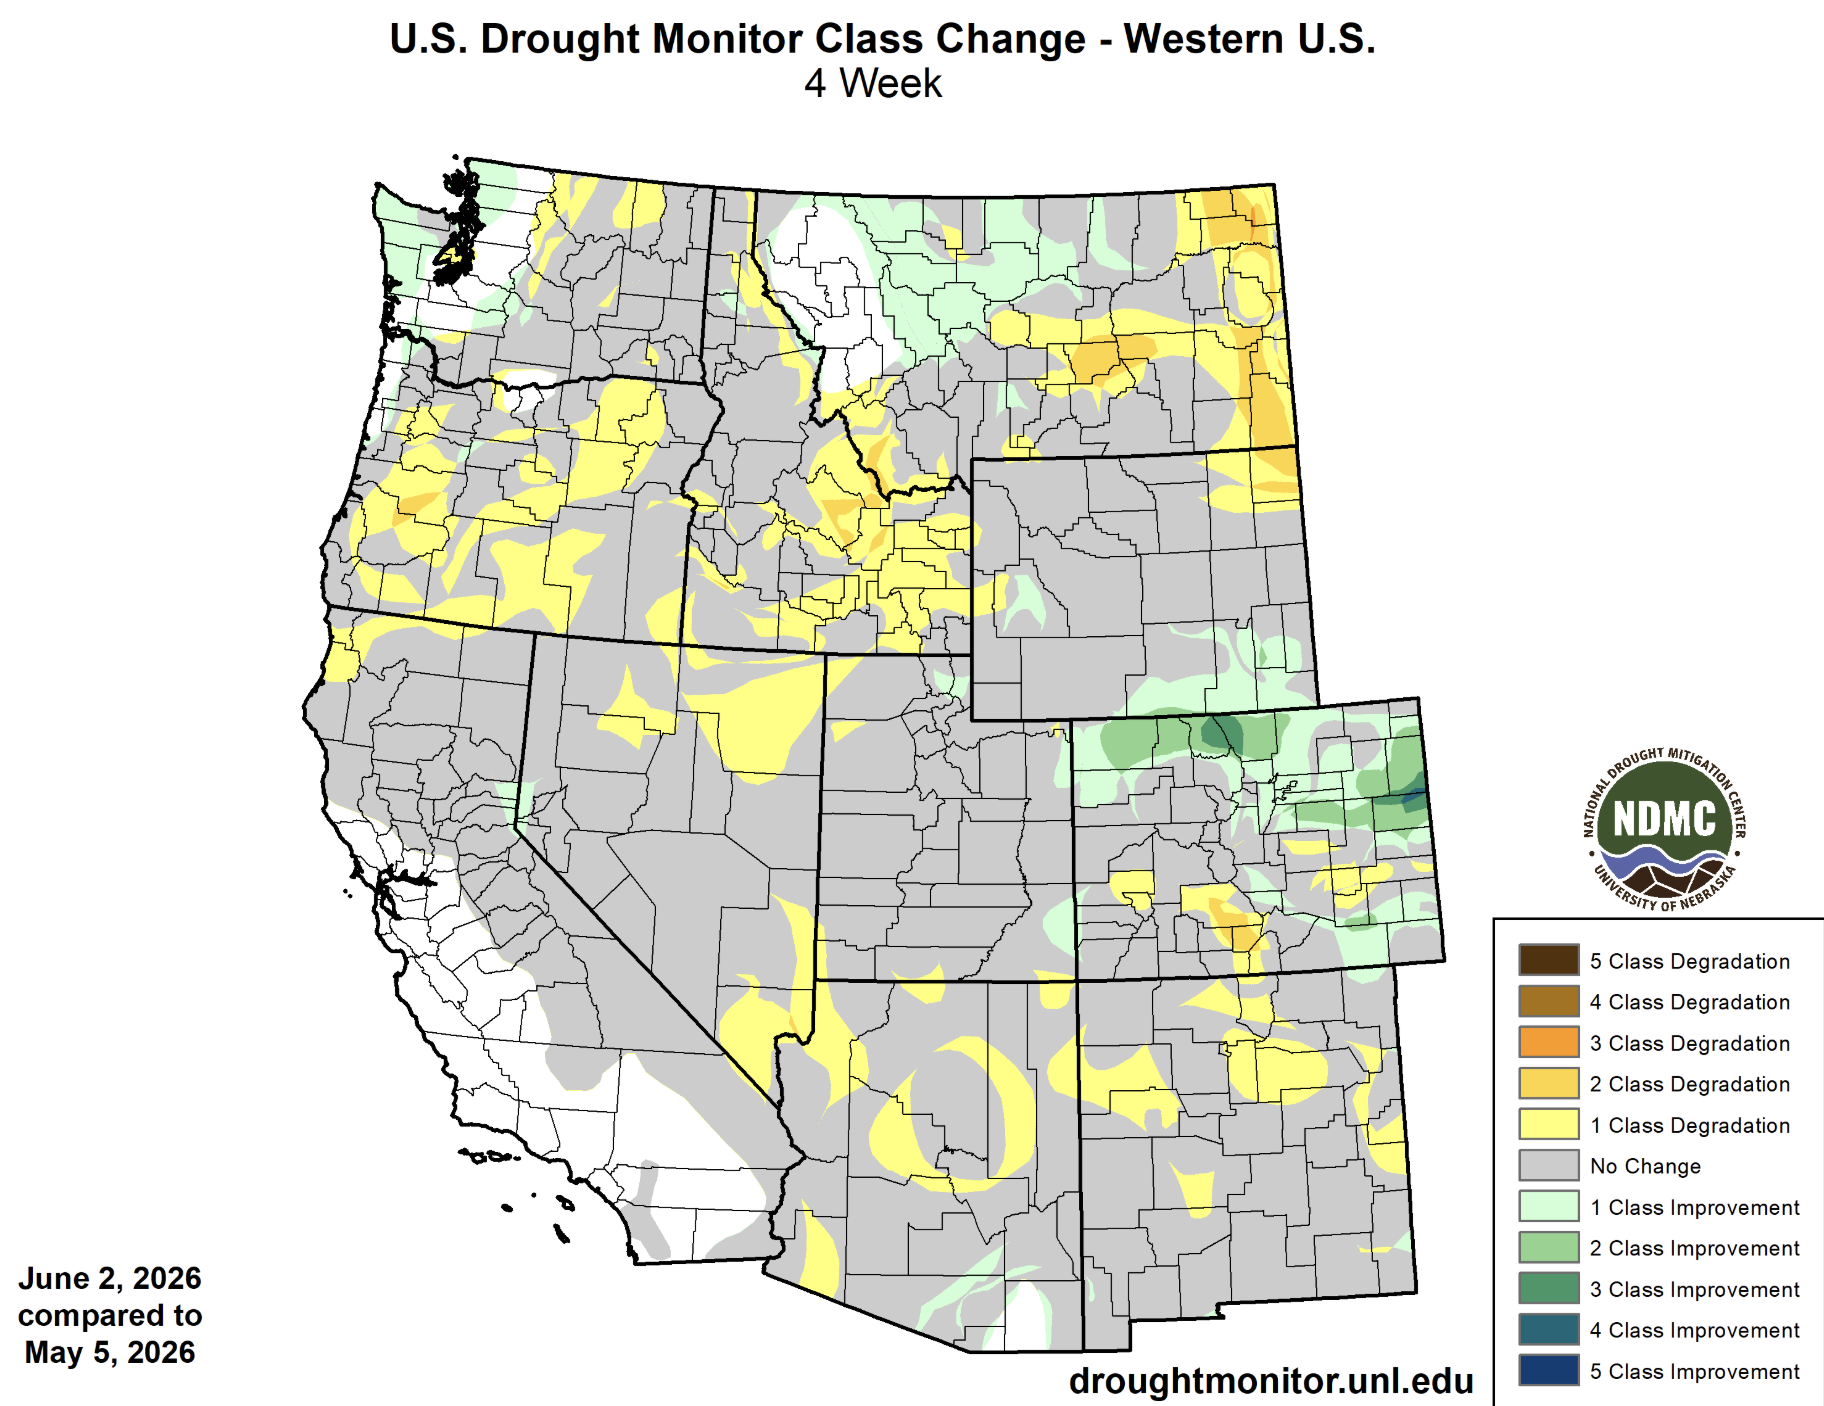
Regional drought coverage remained the same during June and covered 97% of the region as of June 30. Drought conditions slightly deteriorated in Colorado, with severe (D2) drought coverage increasing by 4% and extreme (D3) drought coverage increasing by 3%. While all of Utah is under at least moderate (D1) drought conditions, D3 drought coverage decreased by 19%. All of Wyoming is also under at least D1 drought conditions, and D3 drought coverage increased by 10%.
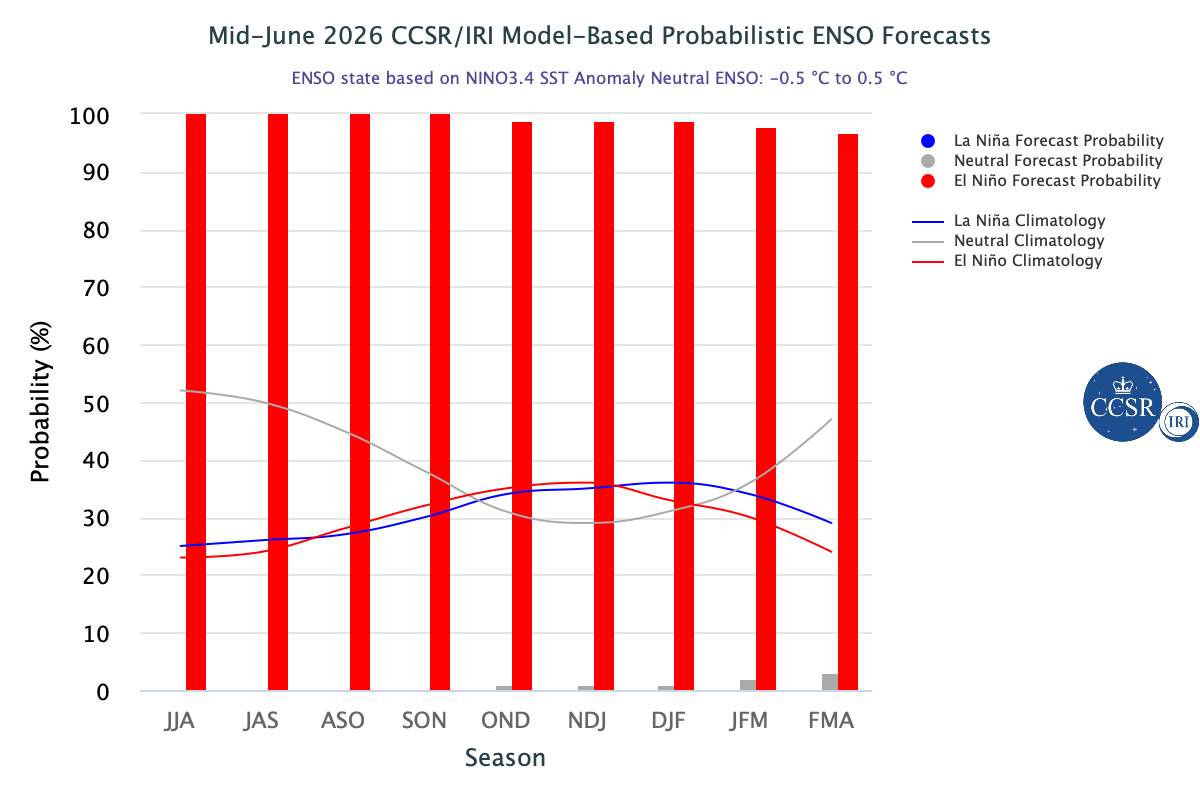
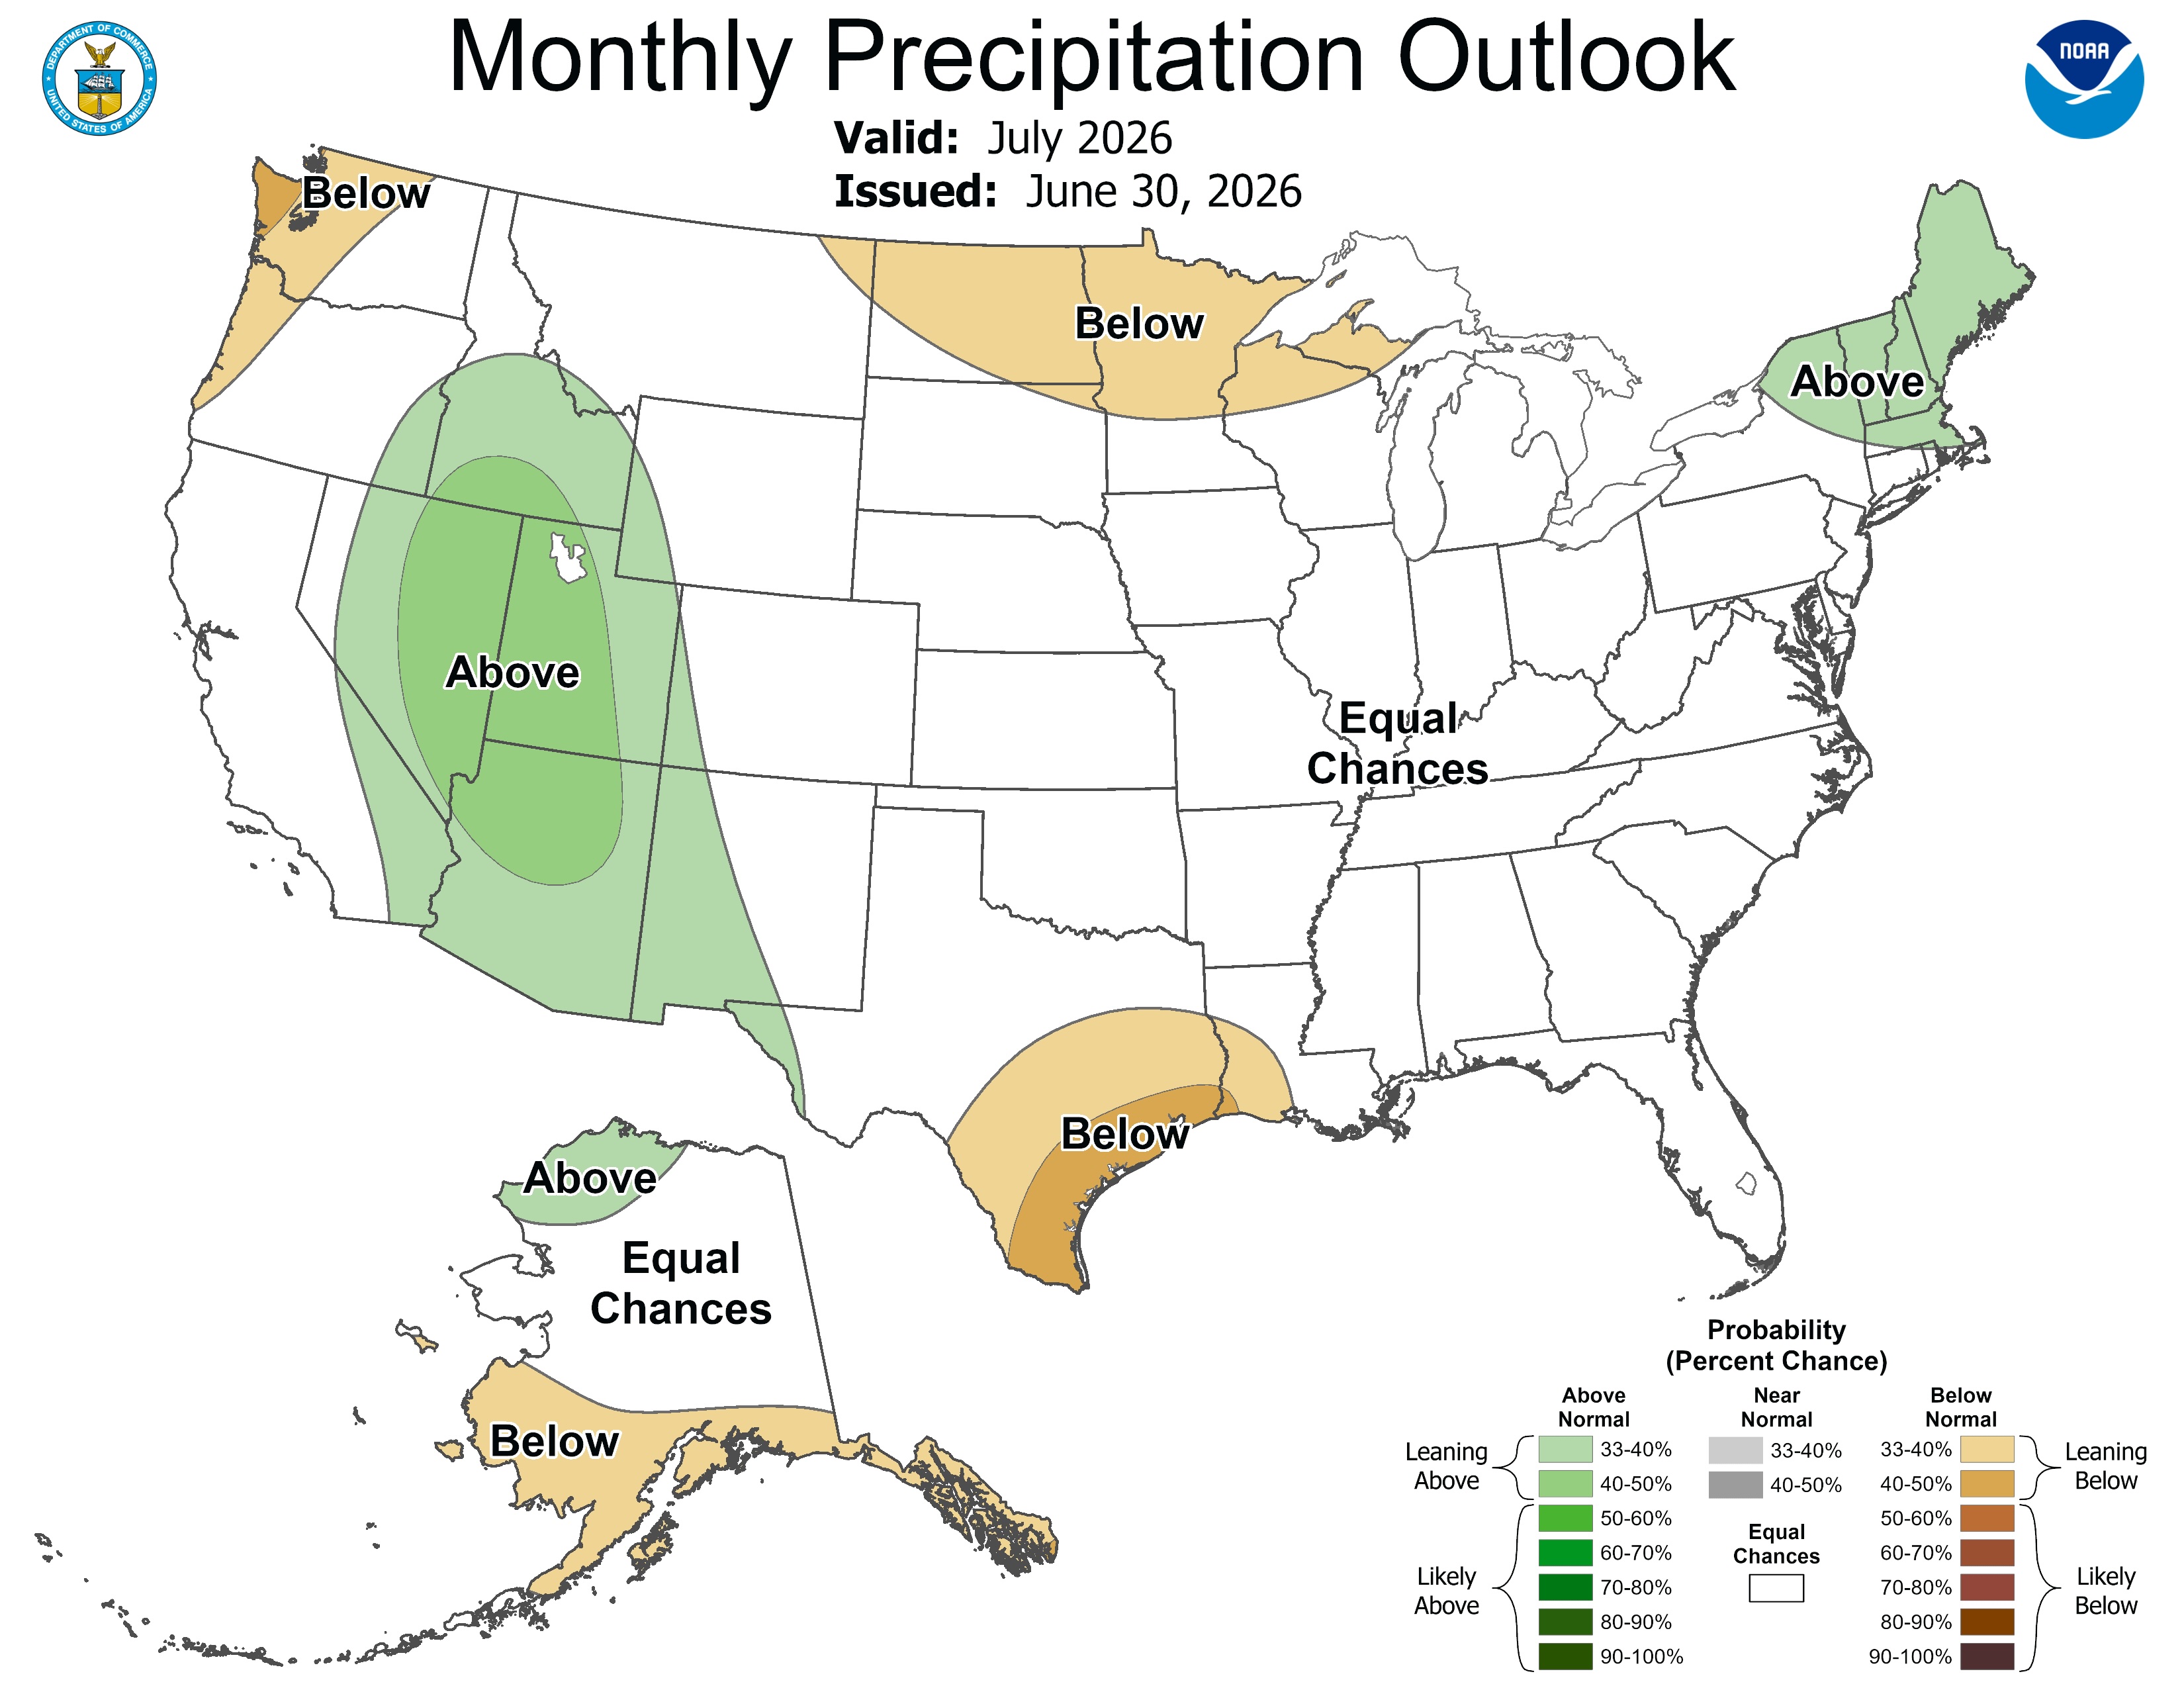
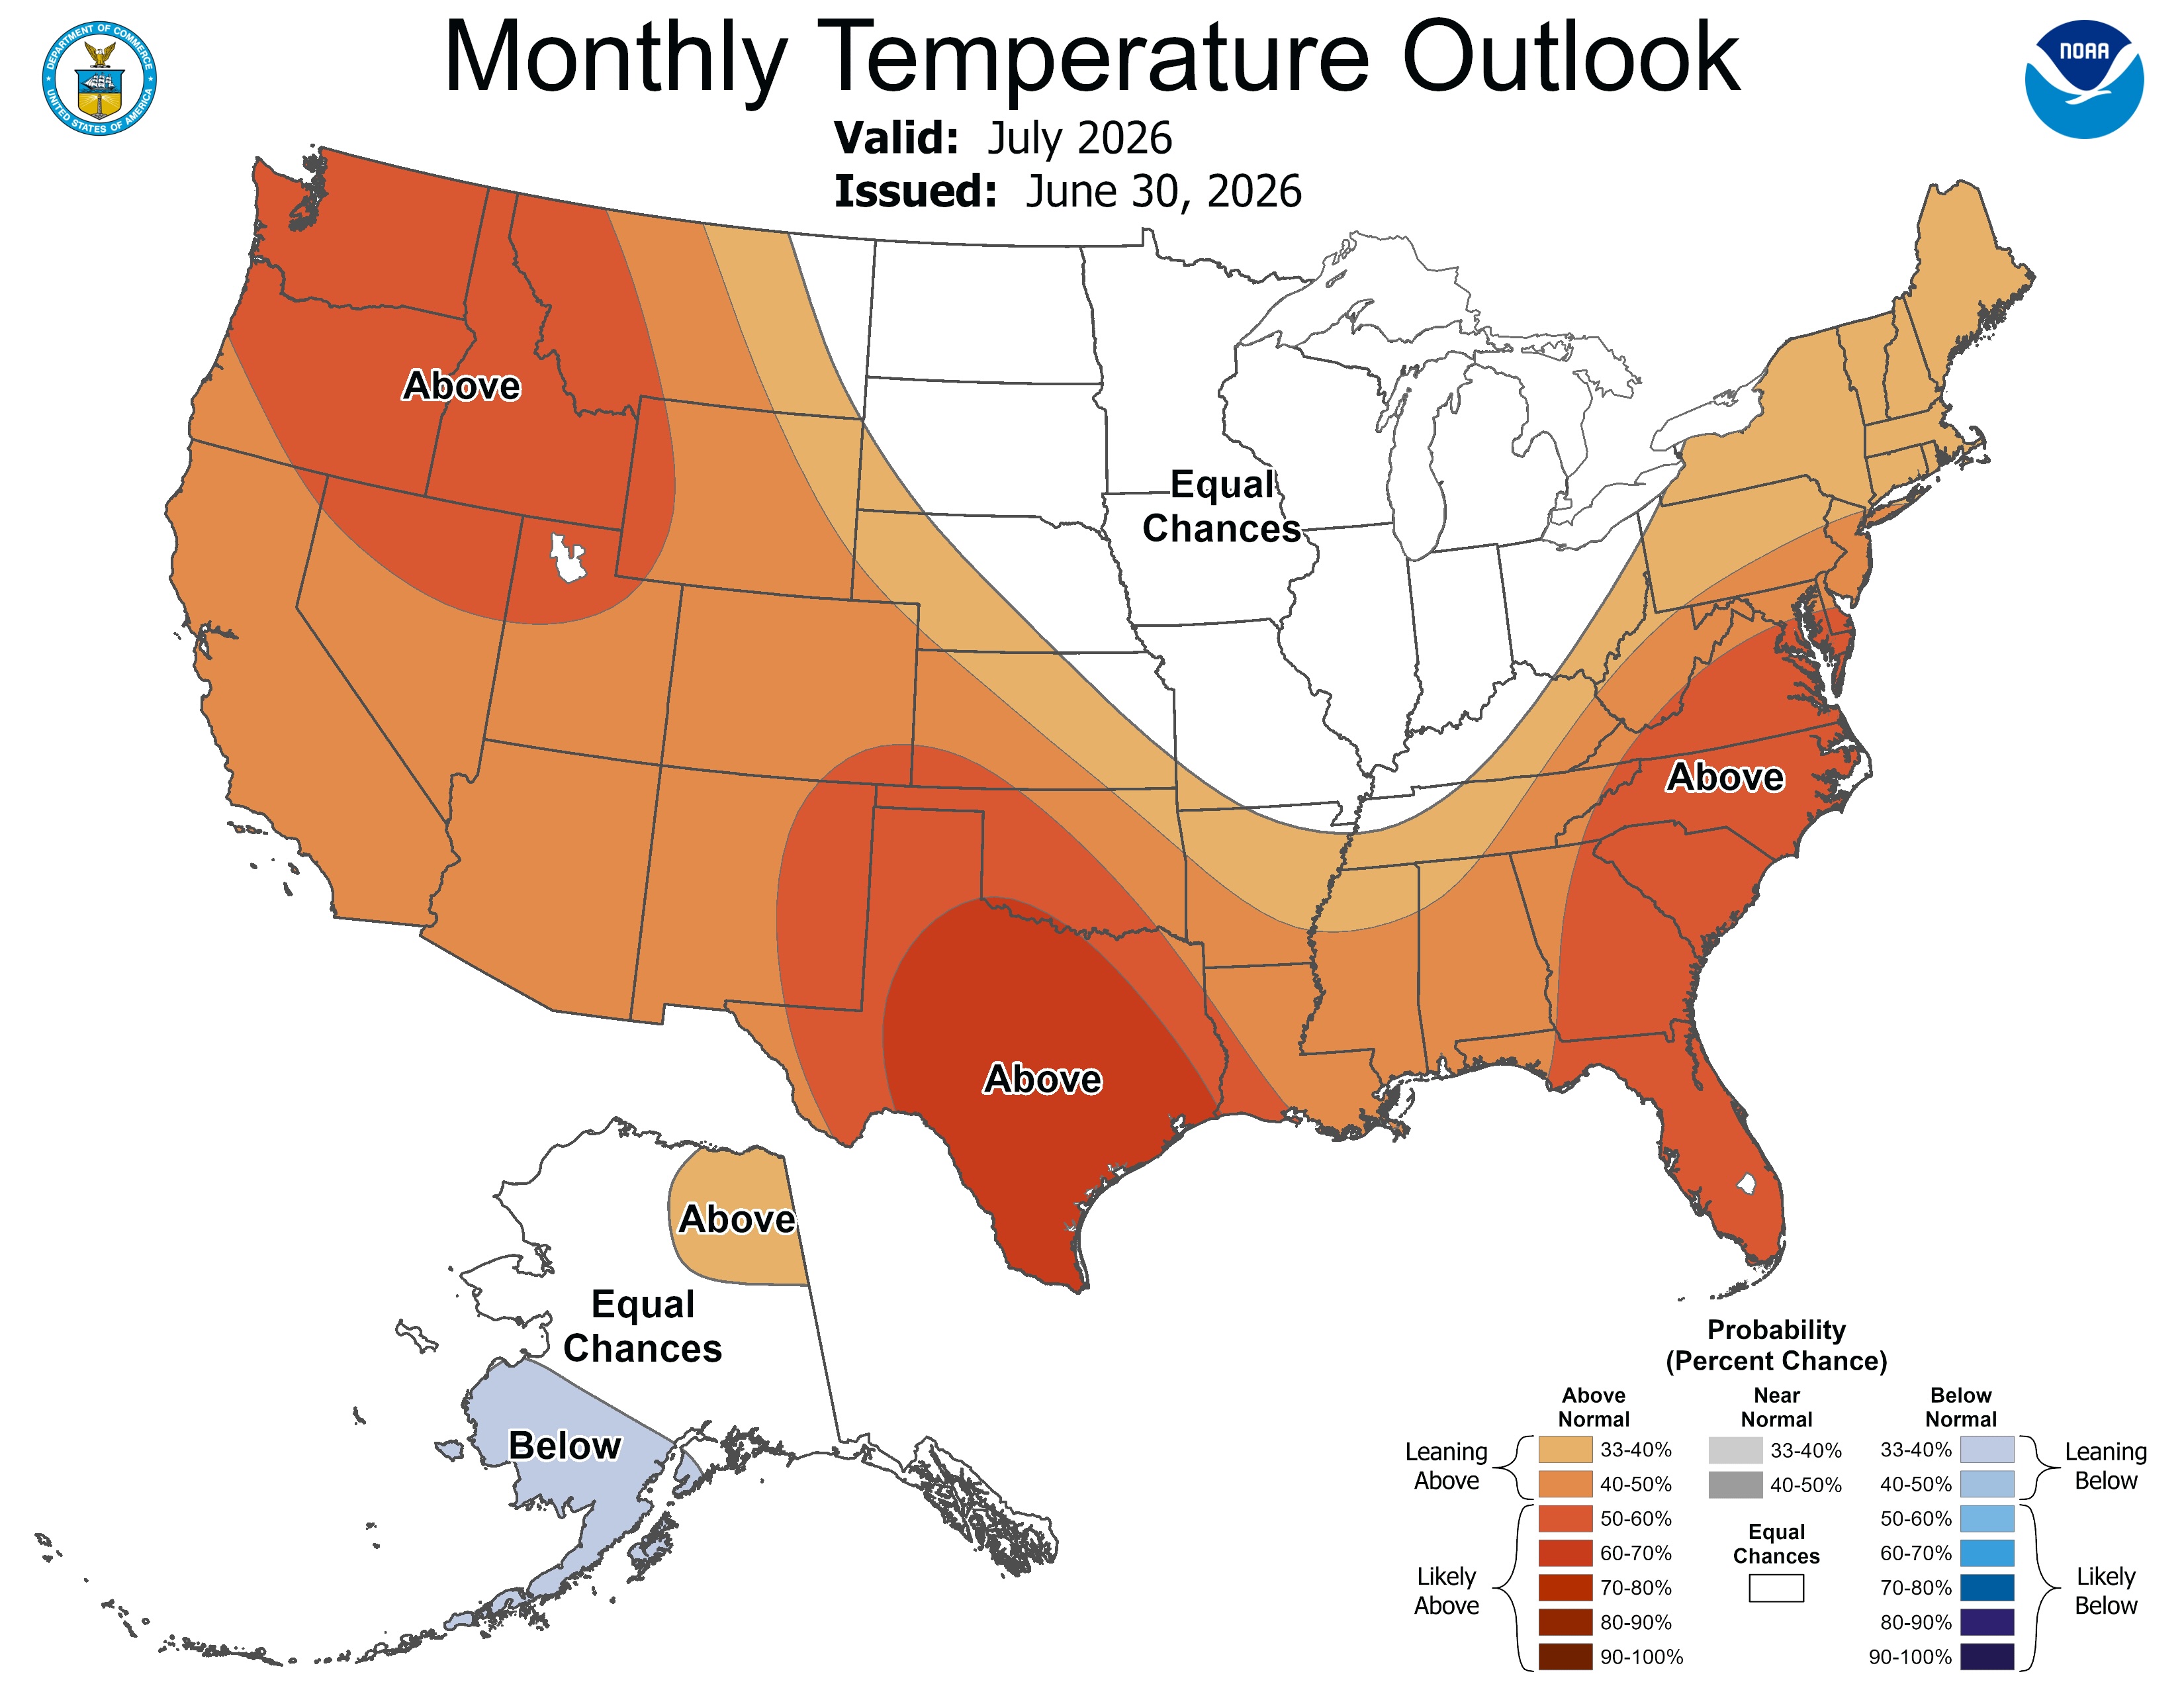
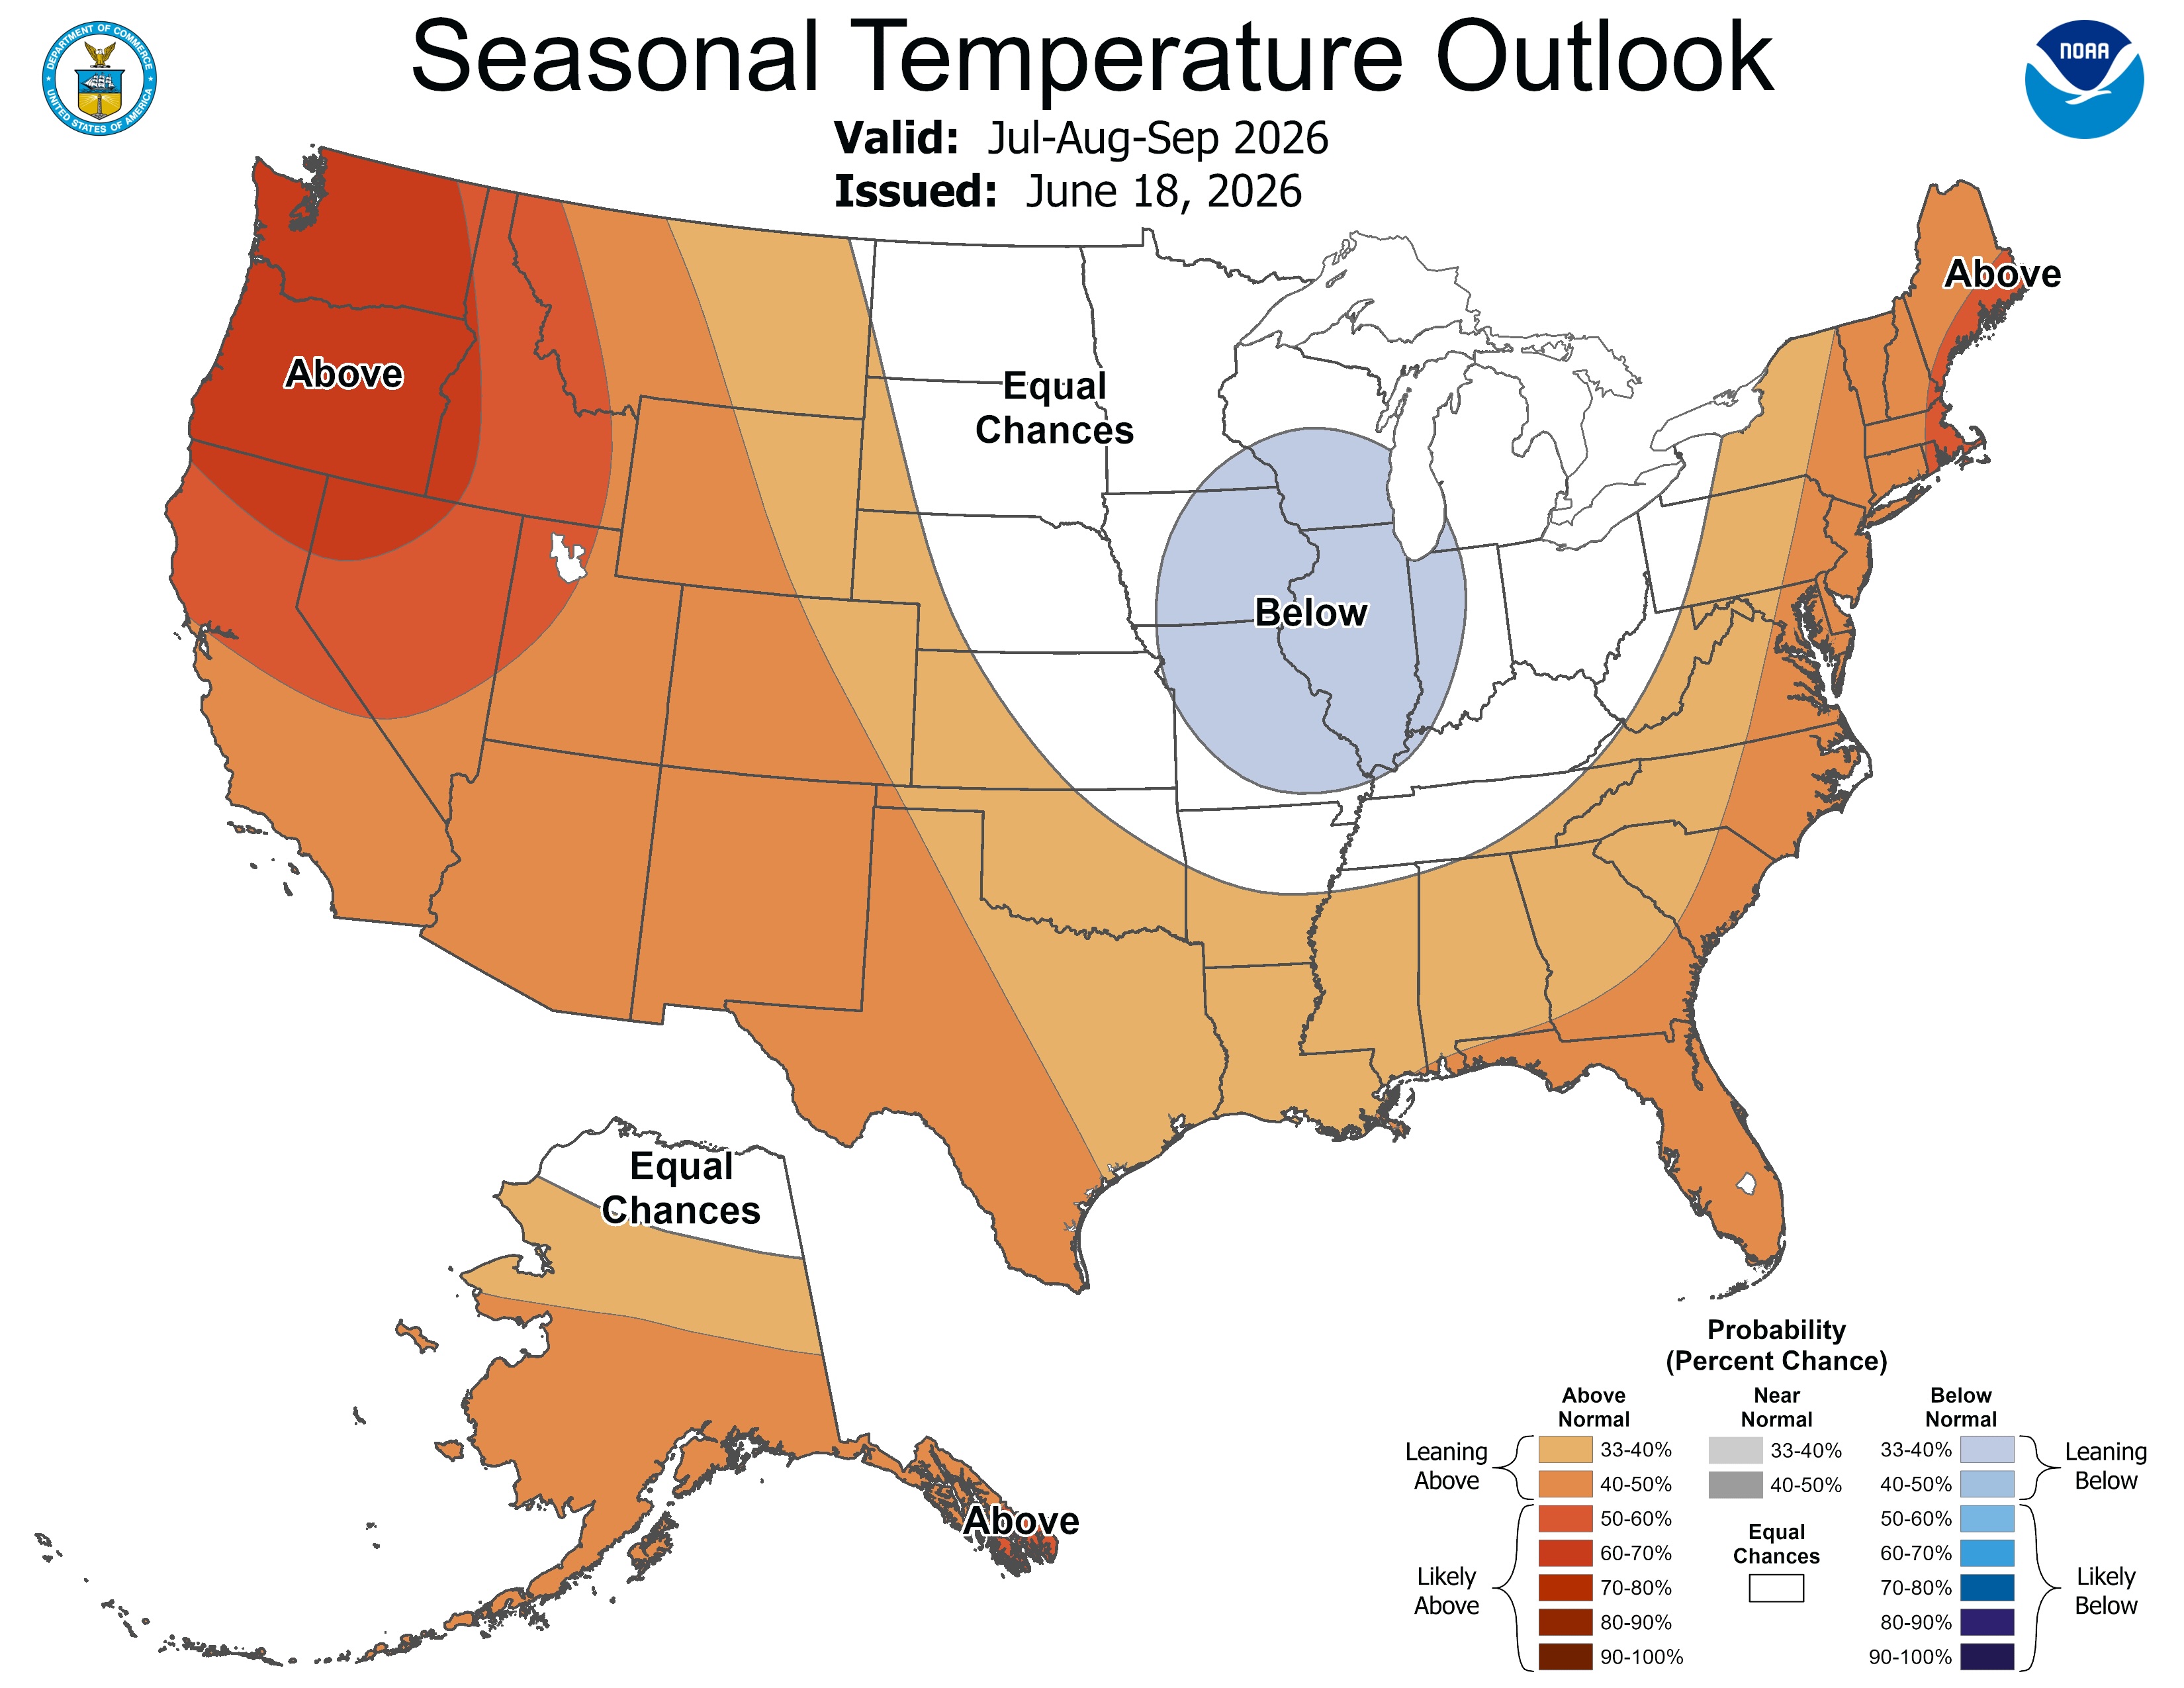
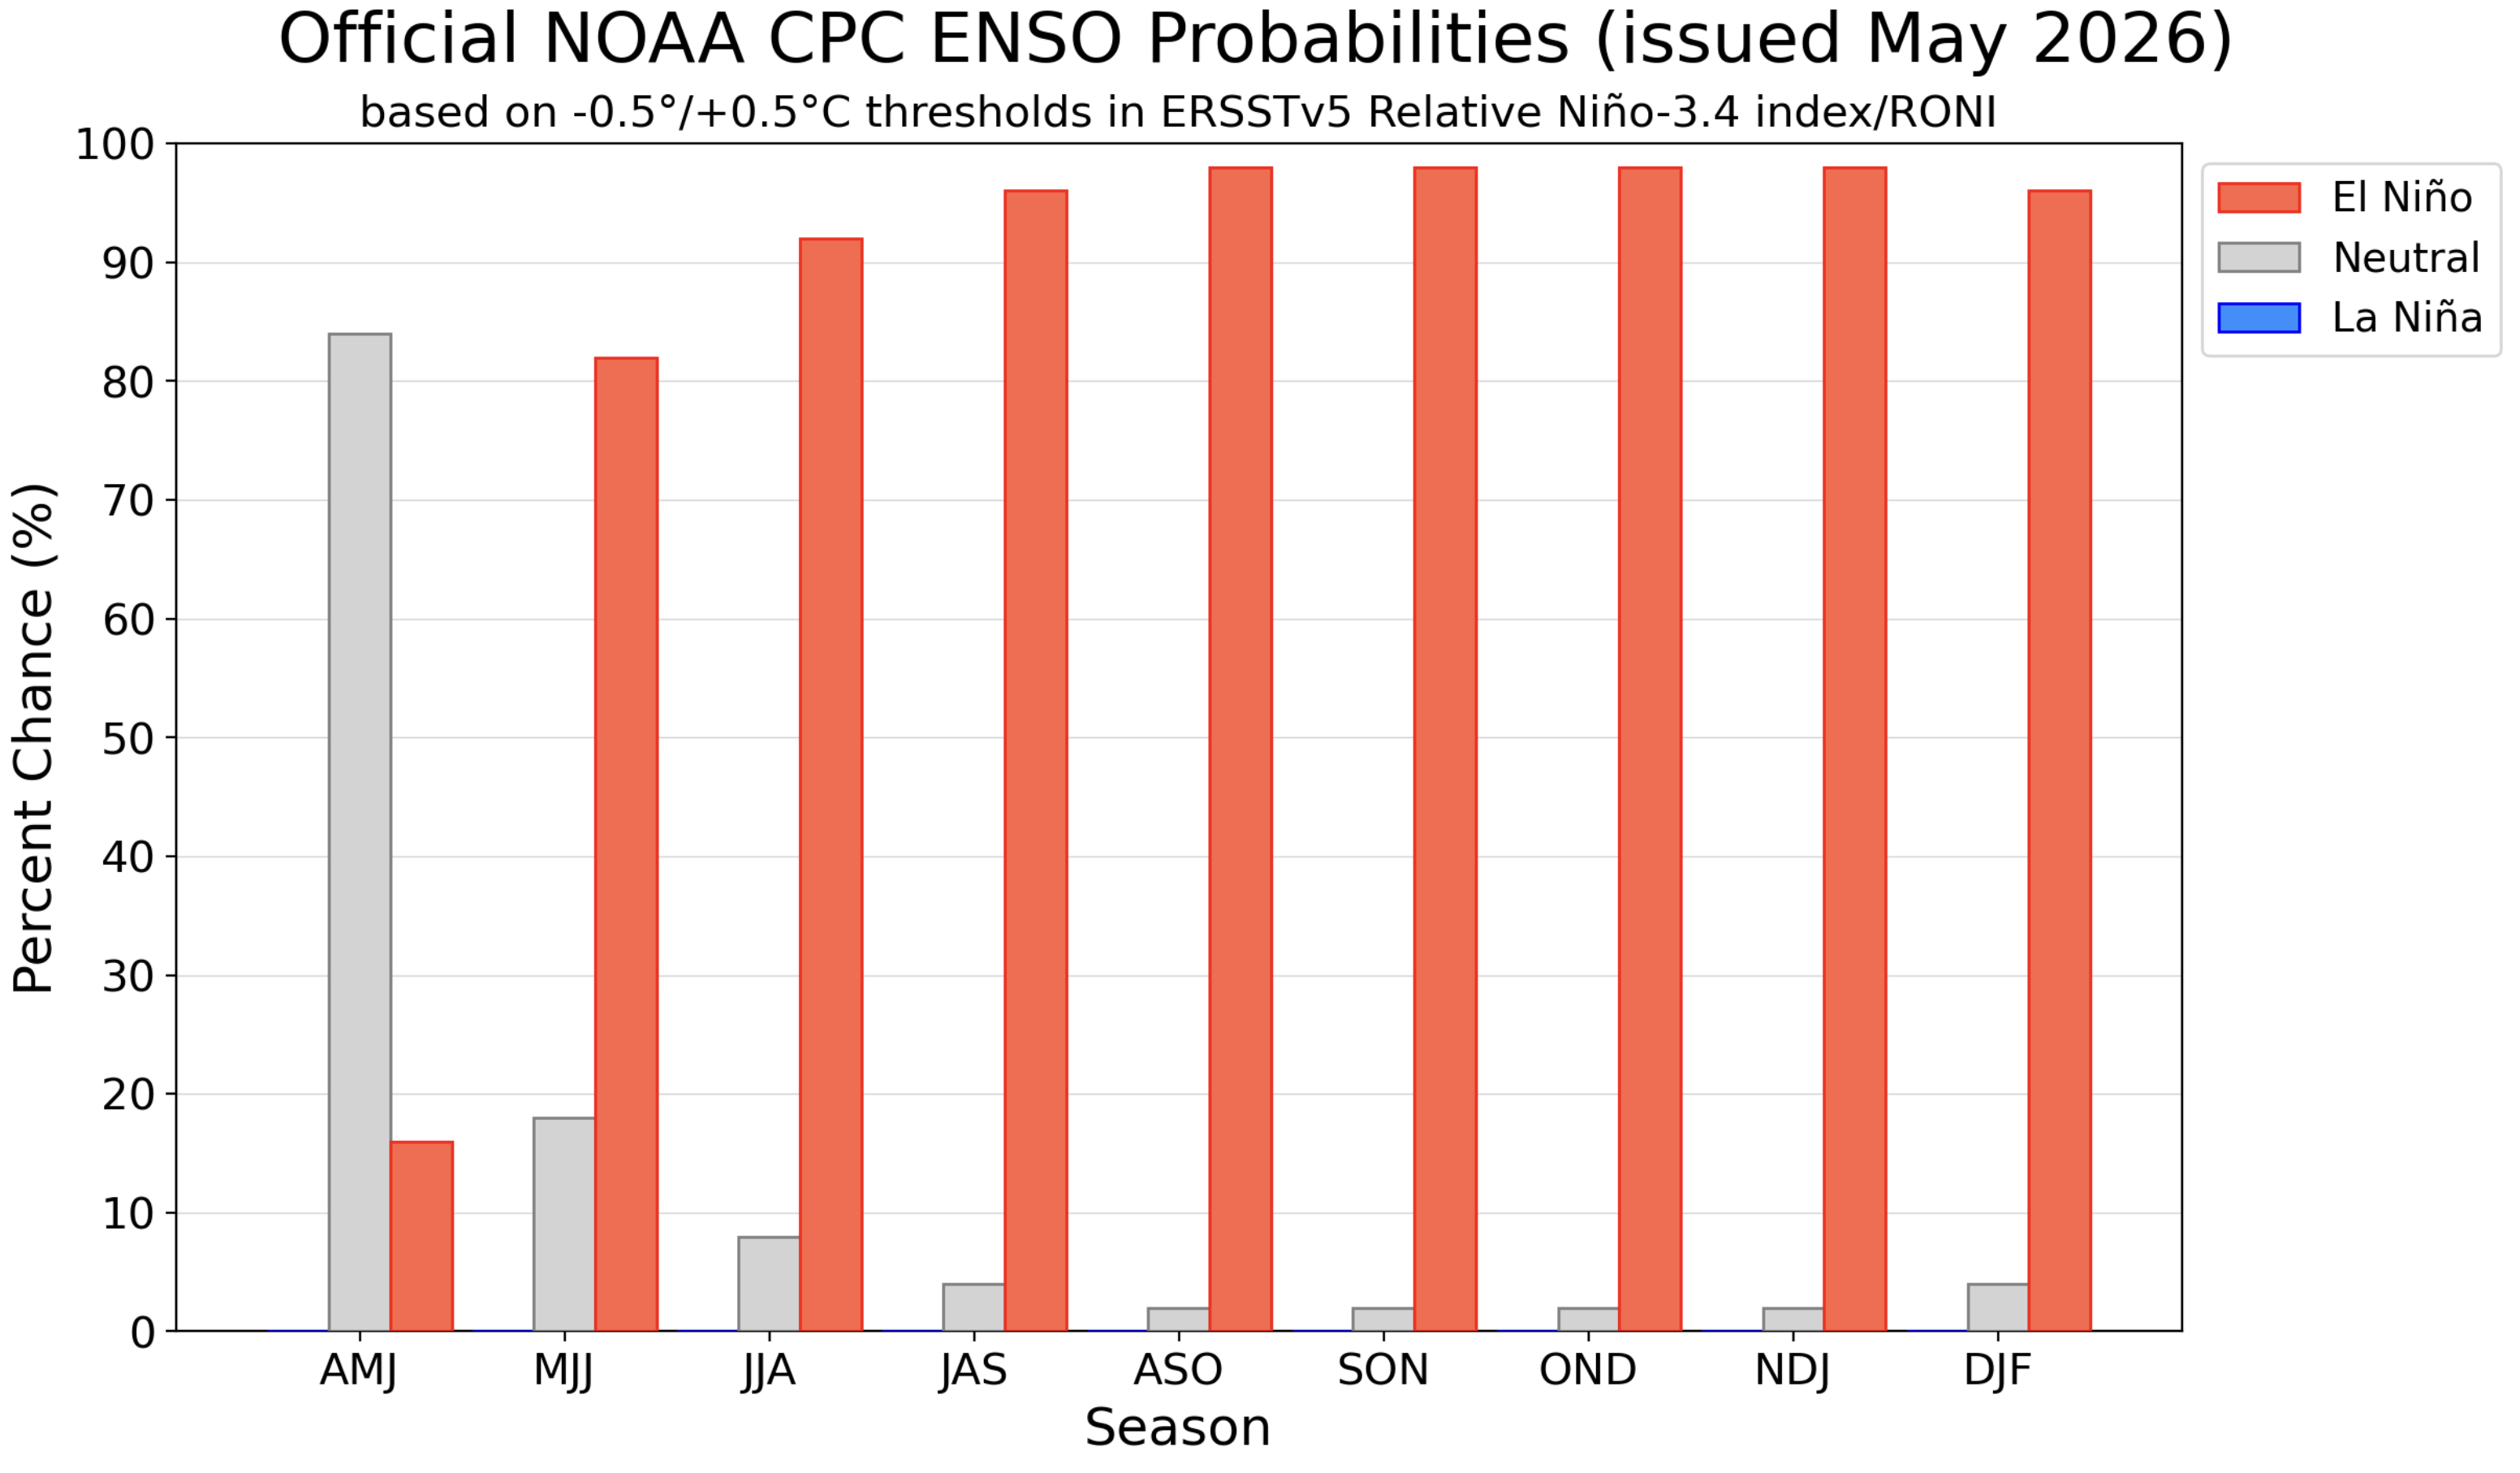
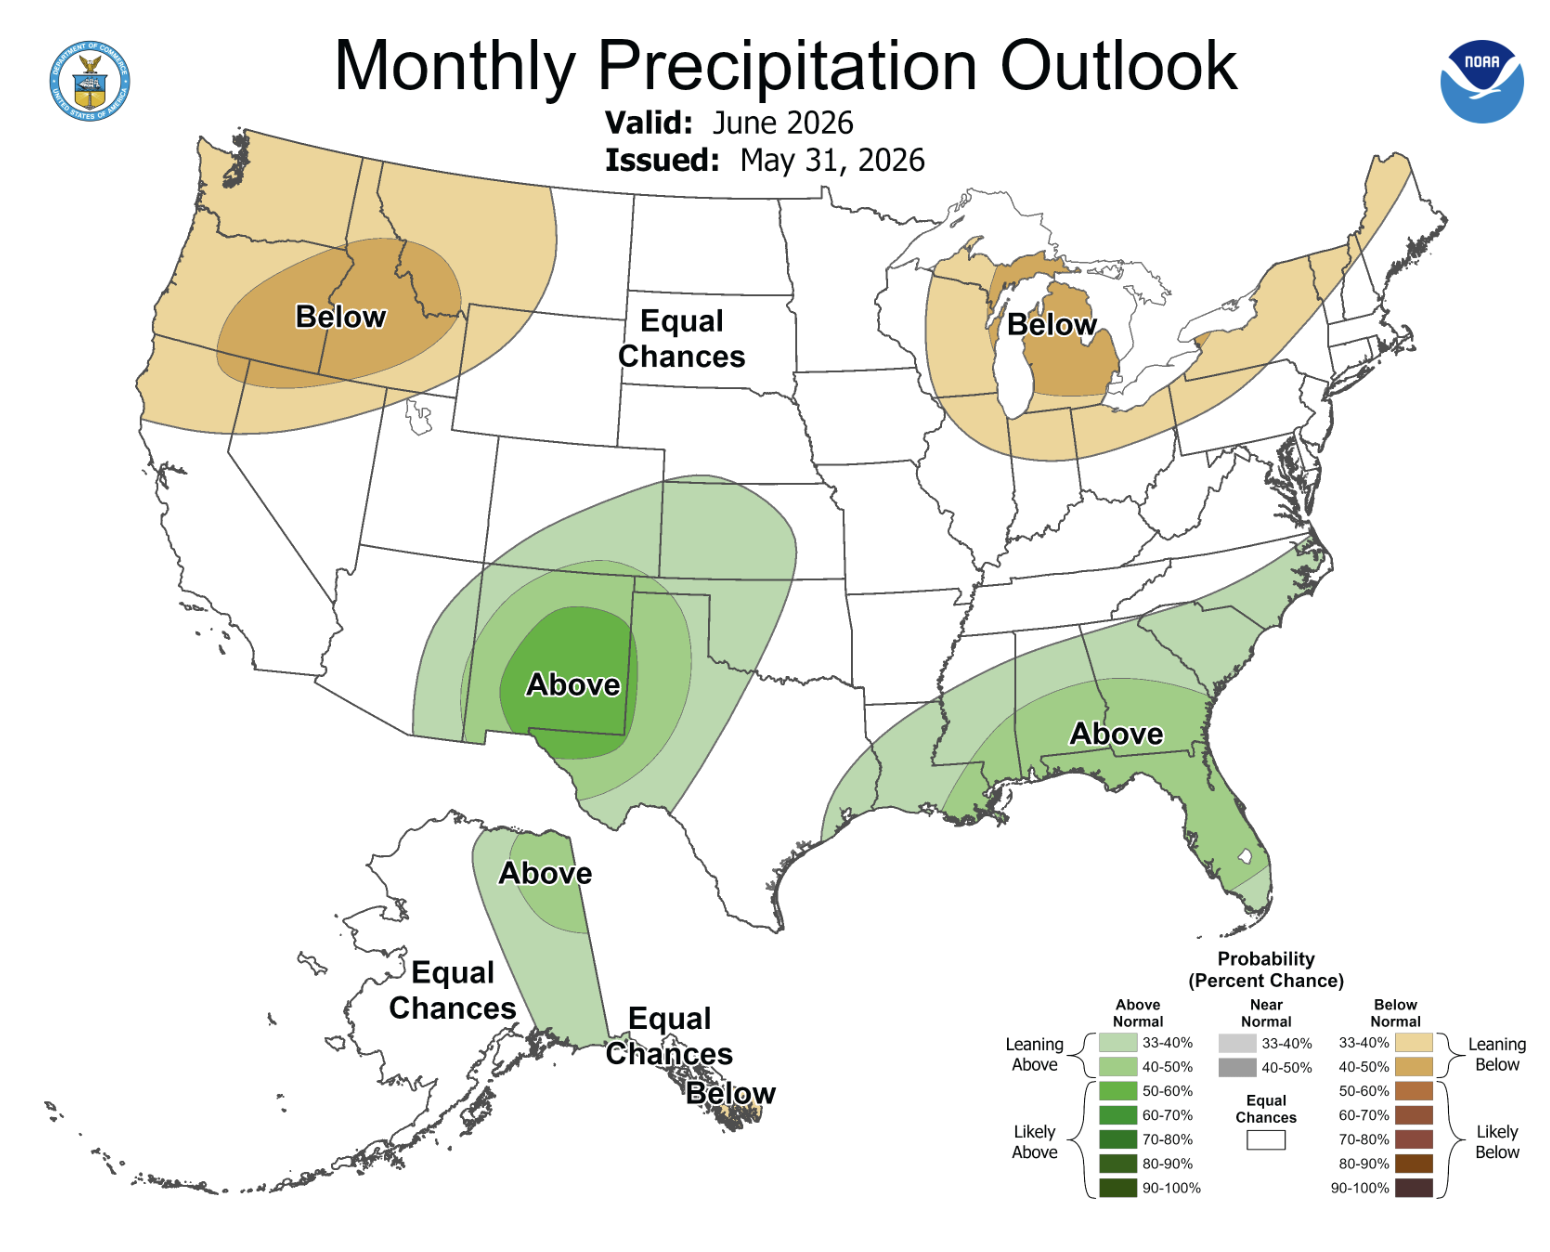
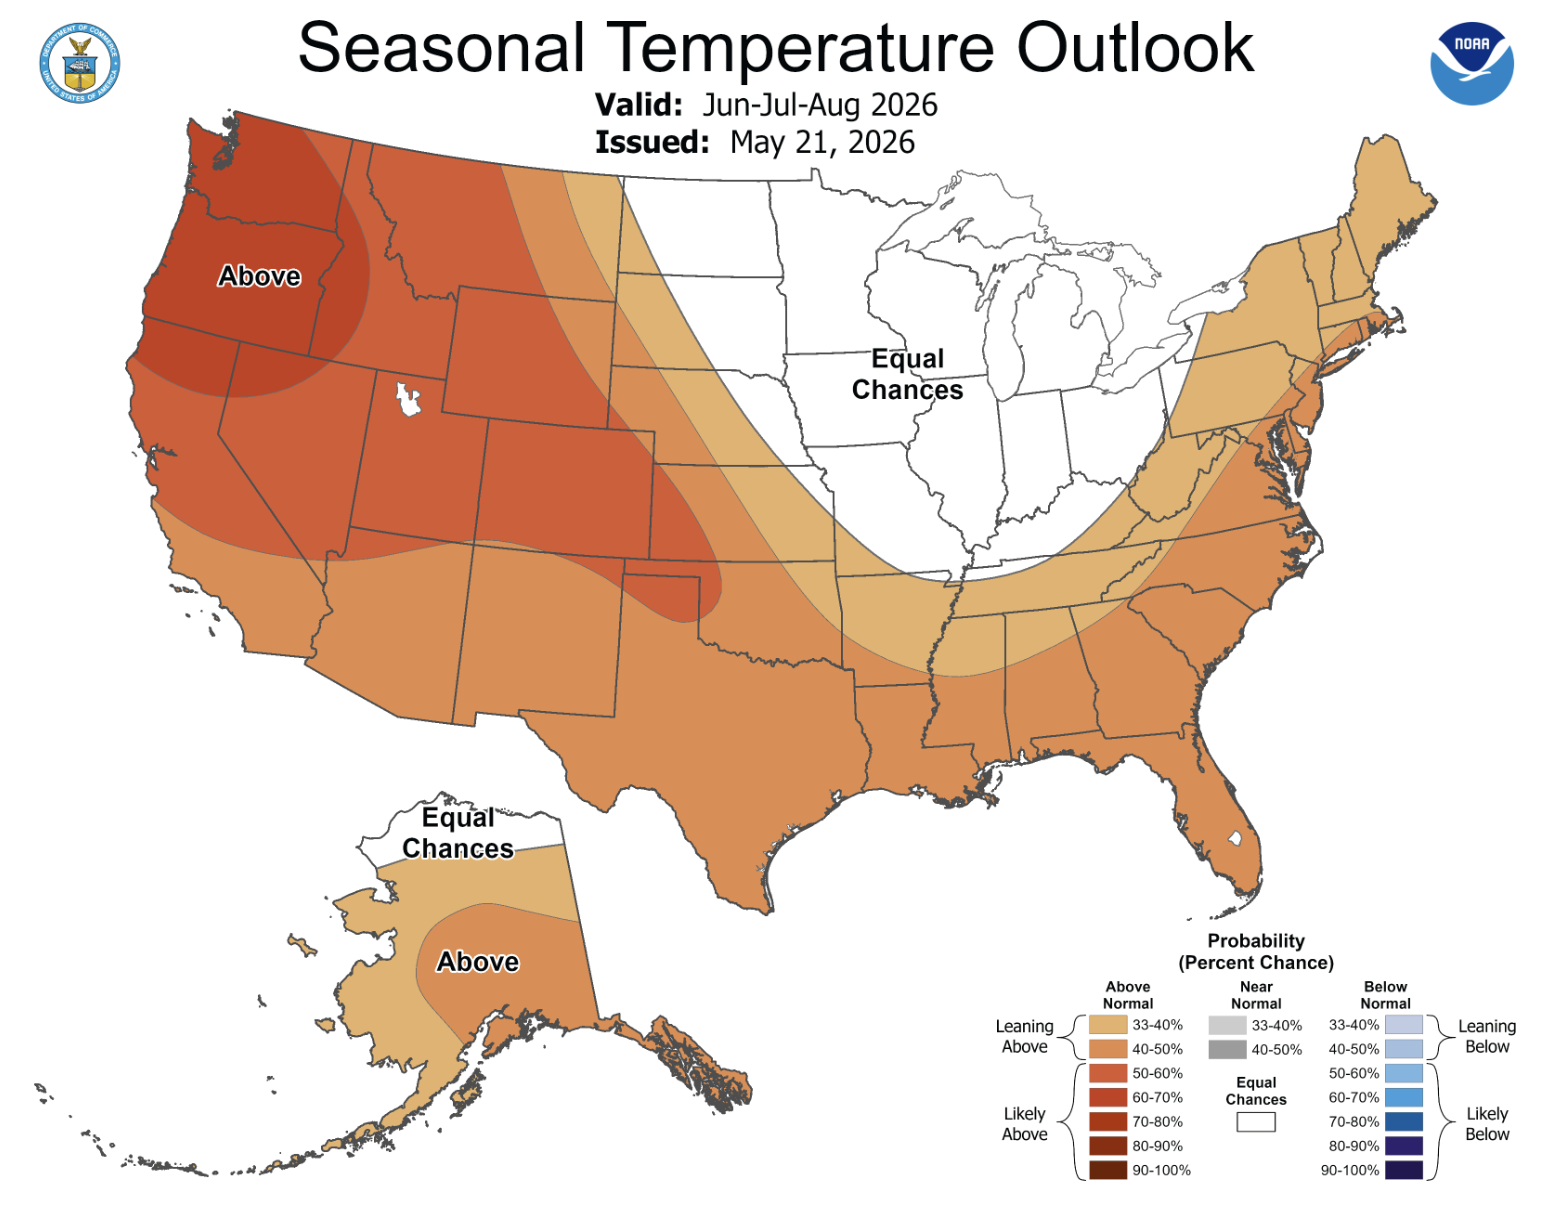
Pacific Ocean temperatures transitioned to El Niño conditions in June. Observed sea surface temperature anomalies were approximately +1.2 °C above average in the Niño 3.4 region, indicating a moderate El Niño. El Niño is favored to persist through winter 2026-27. NOAA precipitation forecasts suggest an active monsoon season with an increased probability of above average precipitation during July for Utah, southwestern Colorado, and southwestern Wyoming, and an increased probability for above average precipitation for most of the region during July–September. NOAA seasonal forecasts suggest an increased probability of above average temperatures for July–September.


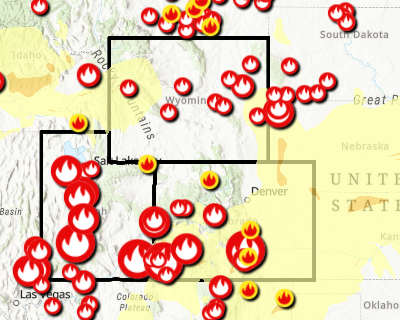
Significant weather event: Late June wildfires. During late June, more than 10 wildfires started across Colorado and Utah. The largest of the fires are the Babylon and Cottonwood fires in Utah, and the Aspen Acres fire in Colorado. These fires collectively have burned hundreds of thousands of acres, destroyed homes and other structures, and strained firefighting resources across the region. Every fire in the list below caused evacuations, with several prompting large-scale community evacuations and state disaster declarations. The Aspen Acres fire has burned more than 275 homes. Three firefighters lost their lives in the Snyder fire, and two more were injured.
Here is a list of wildfires in Colorado and Utah that started in late June and are actively burning at the time this briefing is published on July 9, 2026.
Go to our new Intermountain West Current Wildfires and Smoke Forecast Map for up-to-date information on the following wildfires.
Name of Wildfire | County | Acres Burned | Start Date |
|---|---|---|---|
Babylon | San Juan (UT) | 101,000+ | June 27 |
Cottonwood | Beaver, Piute (UT) | 96,000+ | June 22 |
Aspen Acres | Custer, Pueblo, Huerfano (CO) | 96,000+ | June 29 |
Ferris | Montezuma, Dolores (CO) | 62,000+ | June 27 |
Gold Mountain | Ouray (CO) | 32,000+ | June 27 |
Snyder | Mesa (CO), Grand (UT) | 30,000+ | June 27 |
Wild Goose | Millard (UT) | 12,000+ | June 26 |
Willow | Lake (CO) | 4,000+ | June 28 |
June 8, 2025 - CO, UT, WY
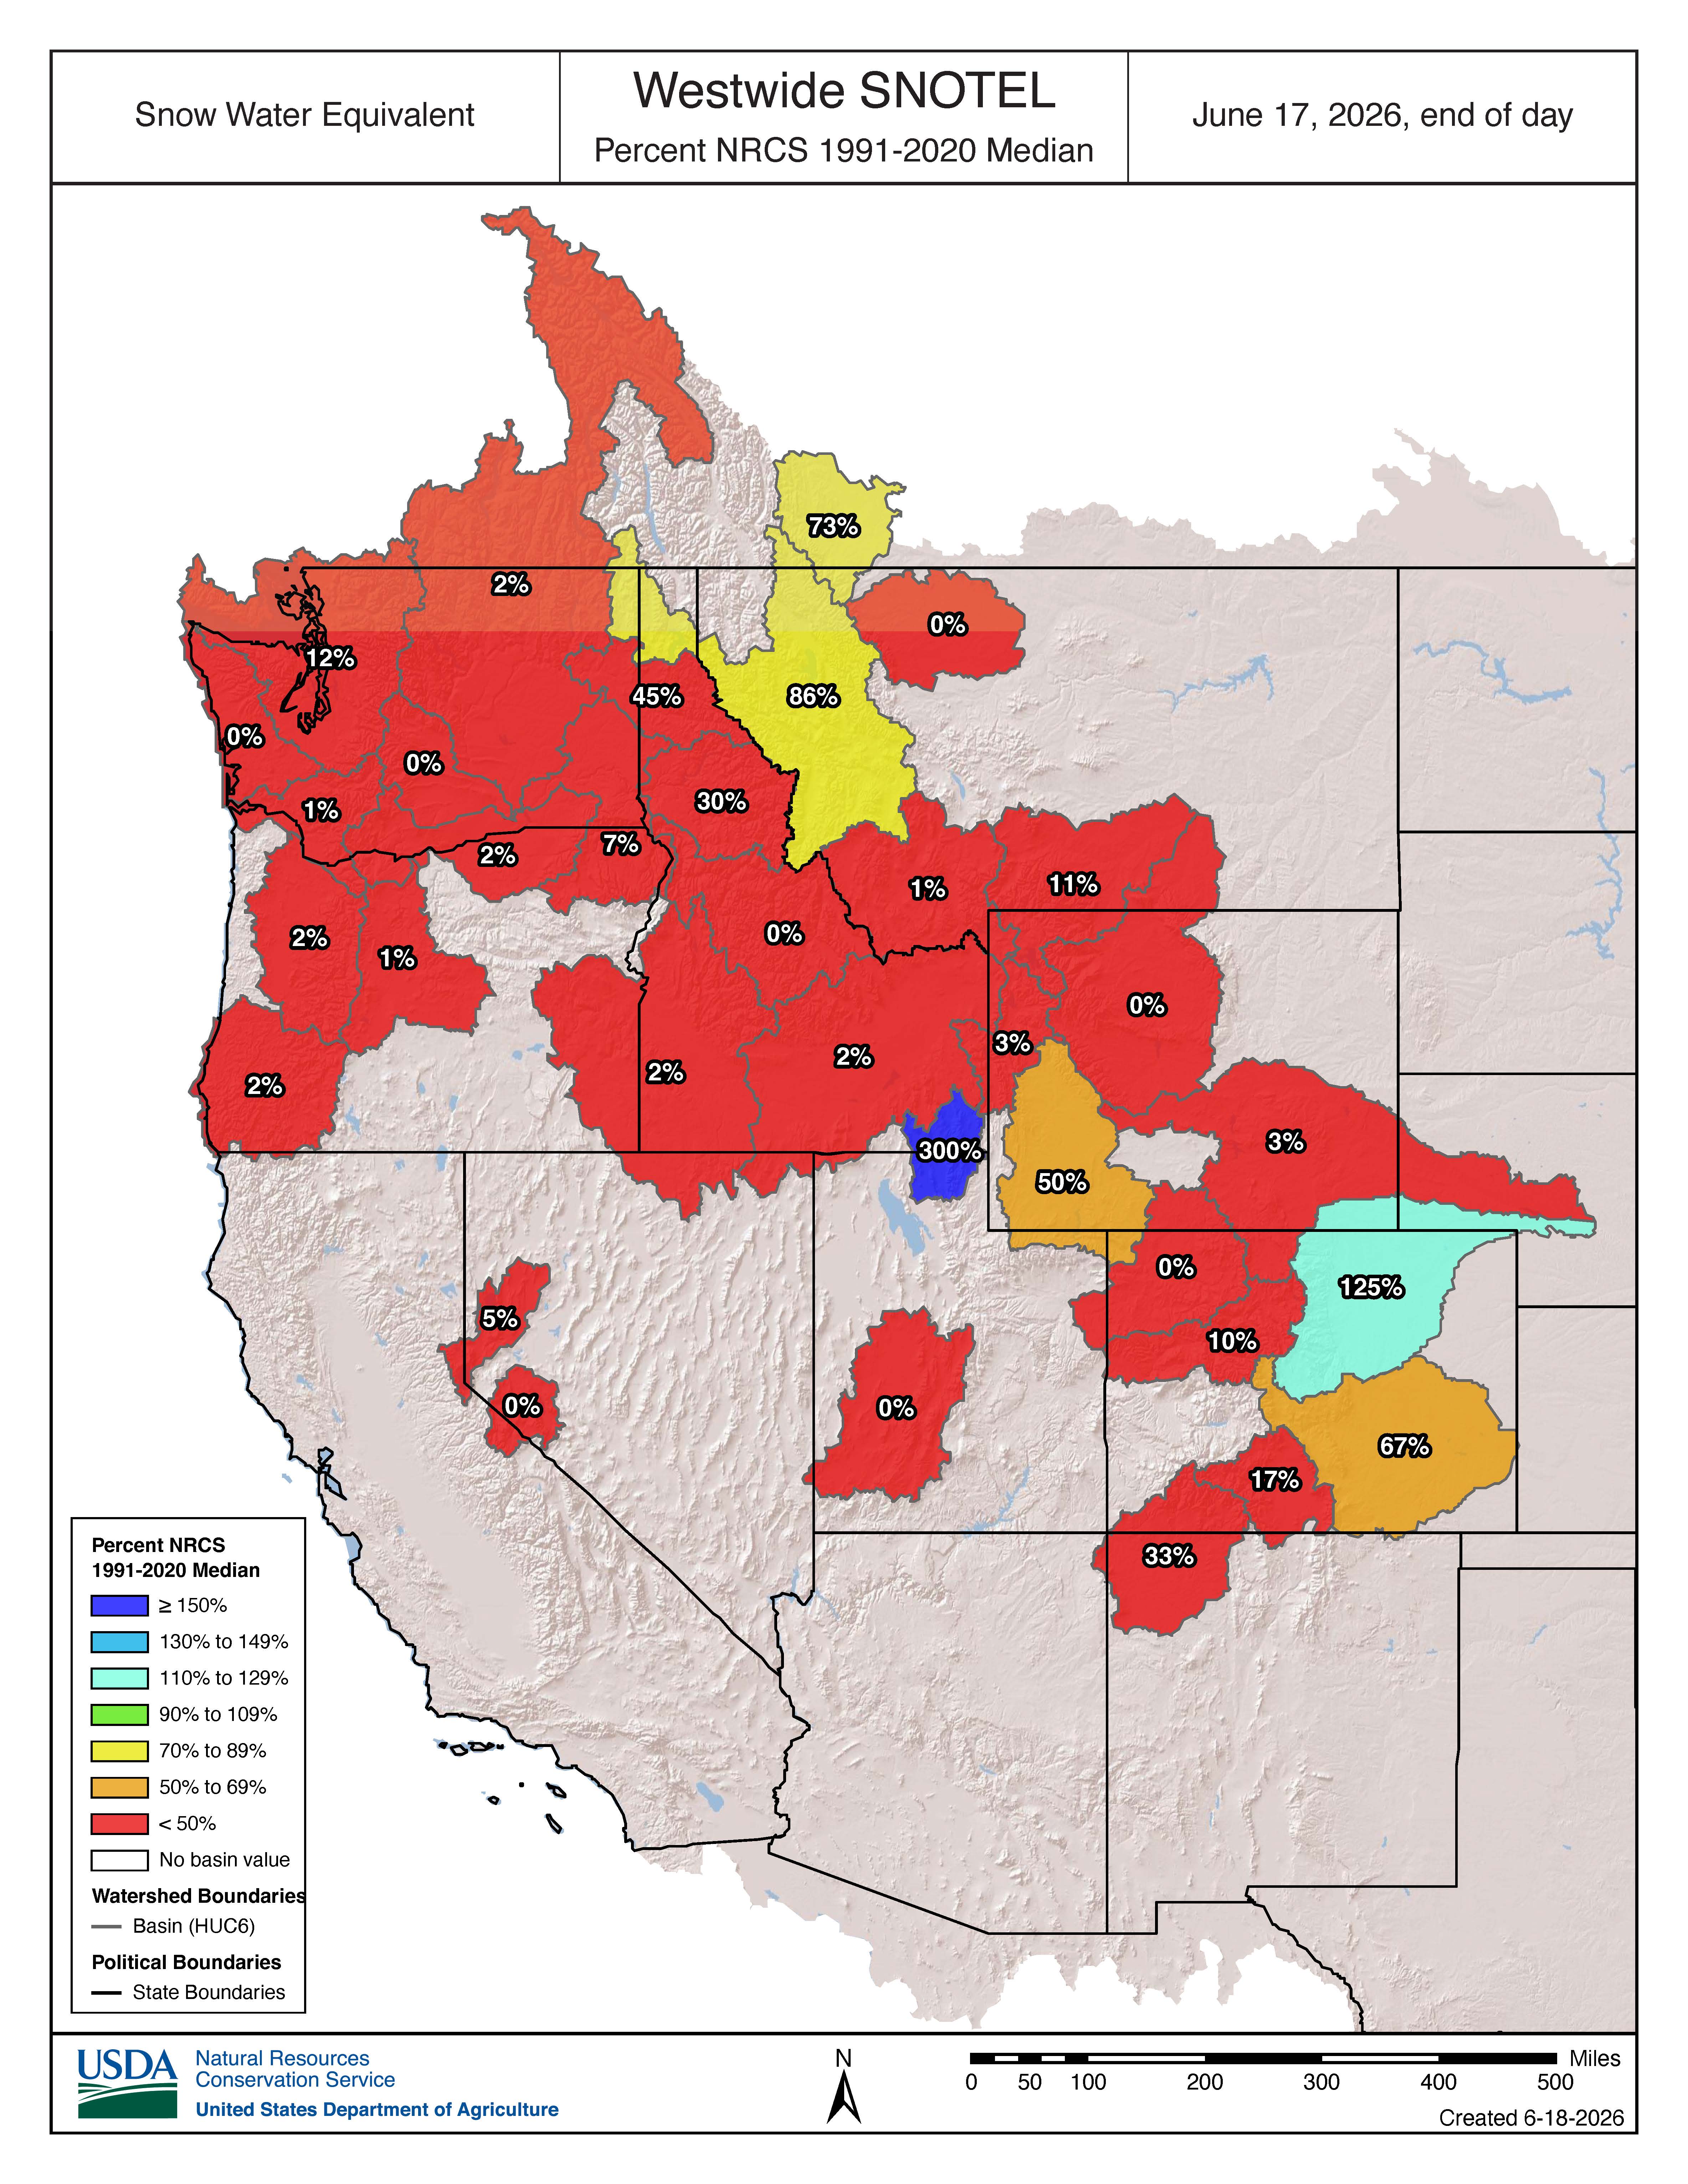
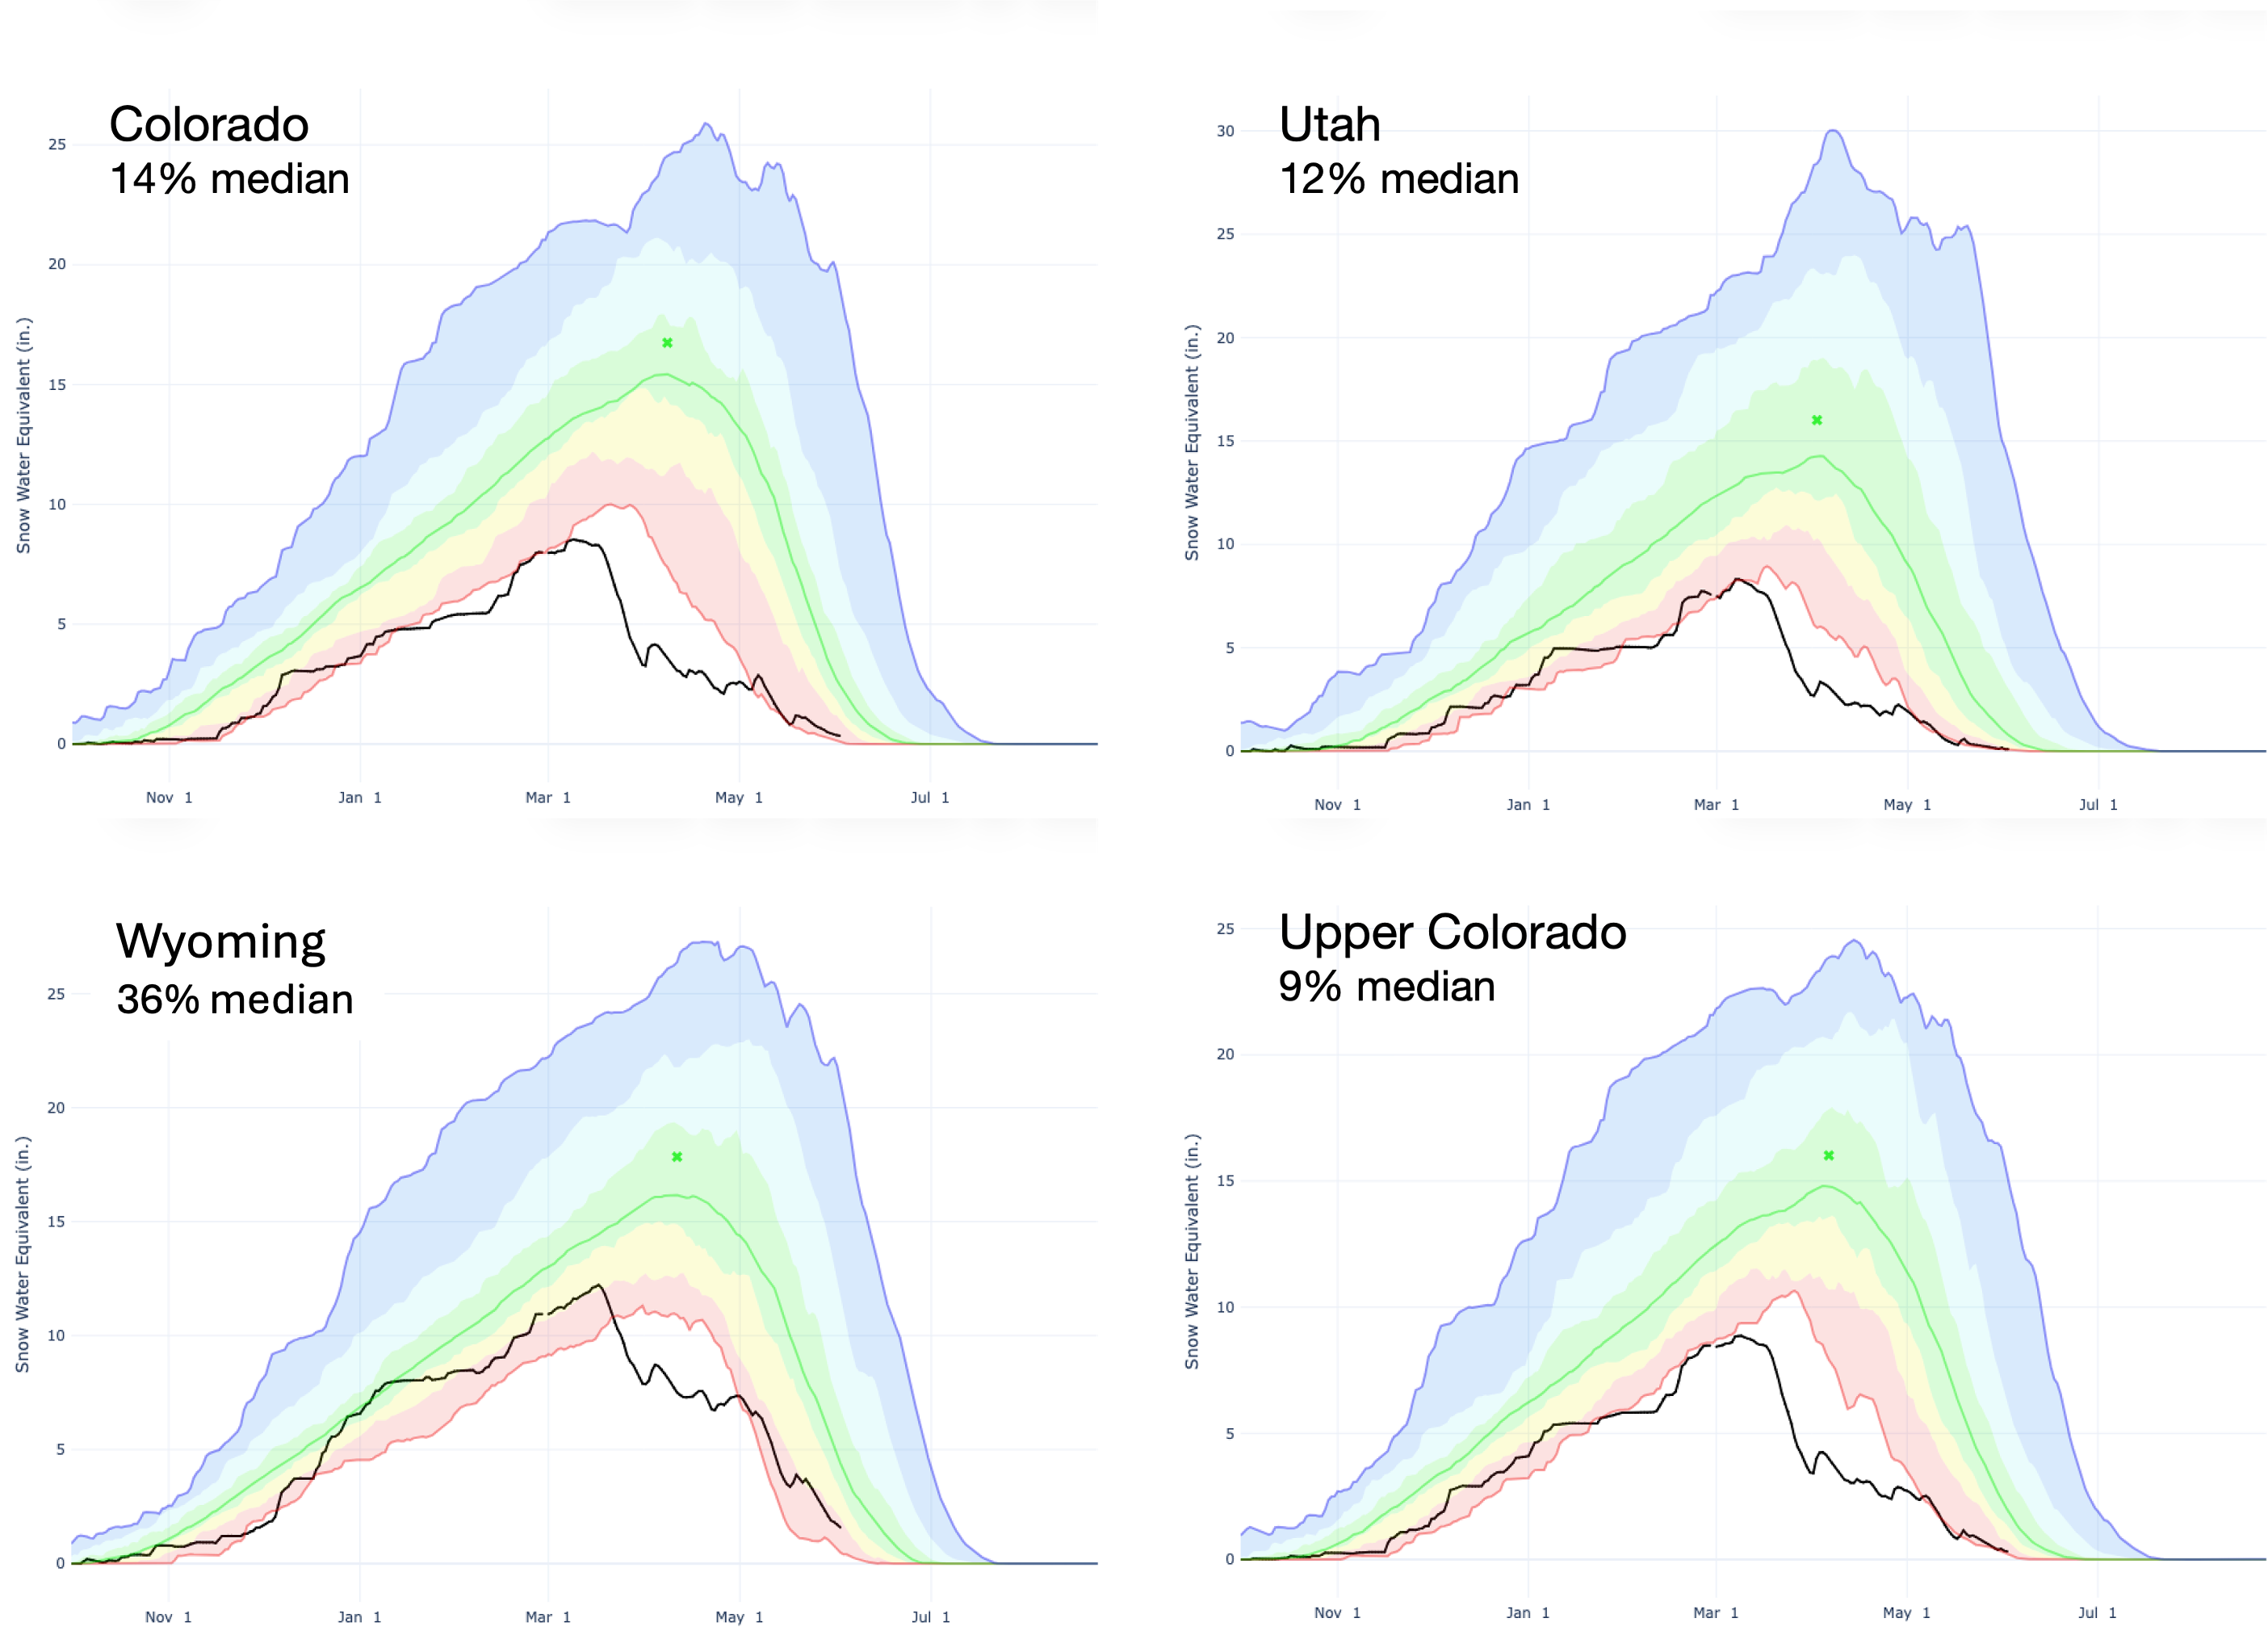
May precipitation was generally below average, except for portions of northern and eastern Colorado, and temperatures were slightly above average. Snowpack conditions continued to deteriorate compared to average during May, and June 1 SWE conditions were near record-low in Colorado (14% of median), Utah (11%), and the Upper Colorado River Basin (9%). Except for northern Wyoming river basins, April – July streamflow volume forecasts are less than 50% of average, and record-low streamflow volumes are forecasted for the Bear, Upper Colorado, White, and Yampa River Basins.
May precipitation was below average for much of the region, with large areas receiving less than half of average precipitation. Southwestern Colorado, southern and western Utah, and northern Wyoming were the driest locations during May. Above average precipitation fell in northeastern Utah and southwestern Wyoming, as well as across a broad swath of northern and eastern Colorado.
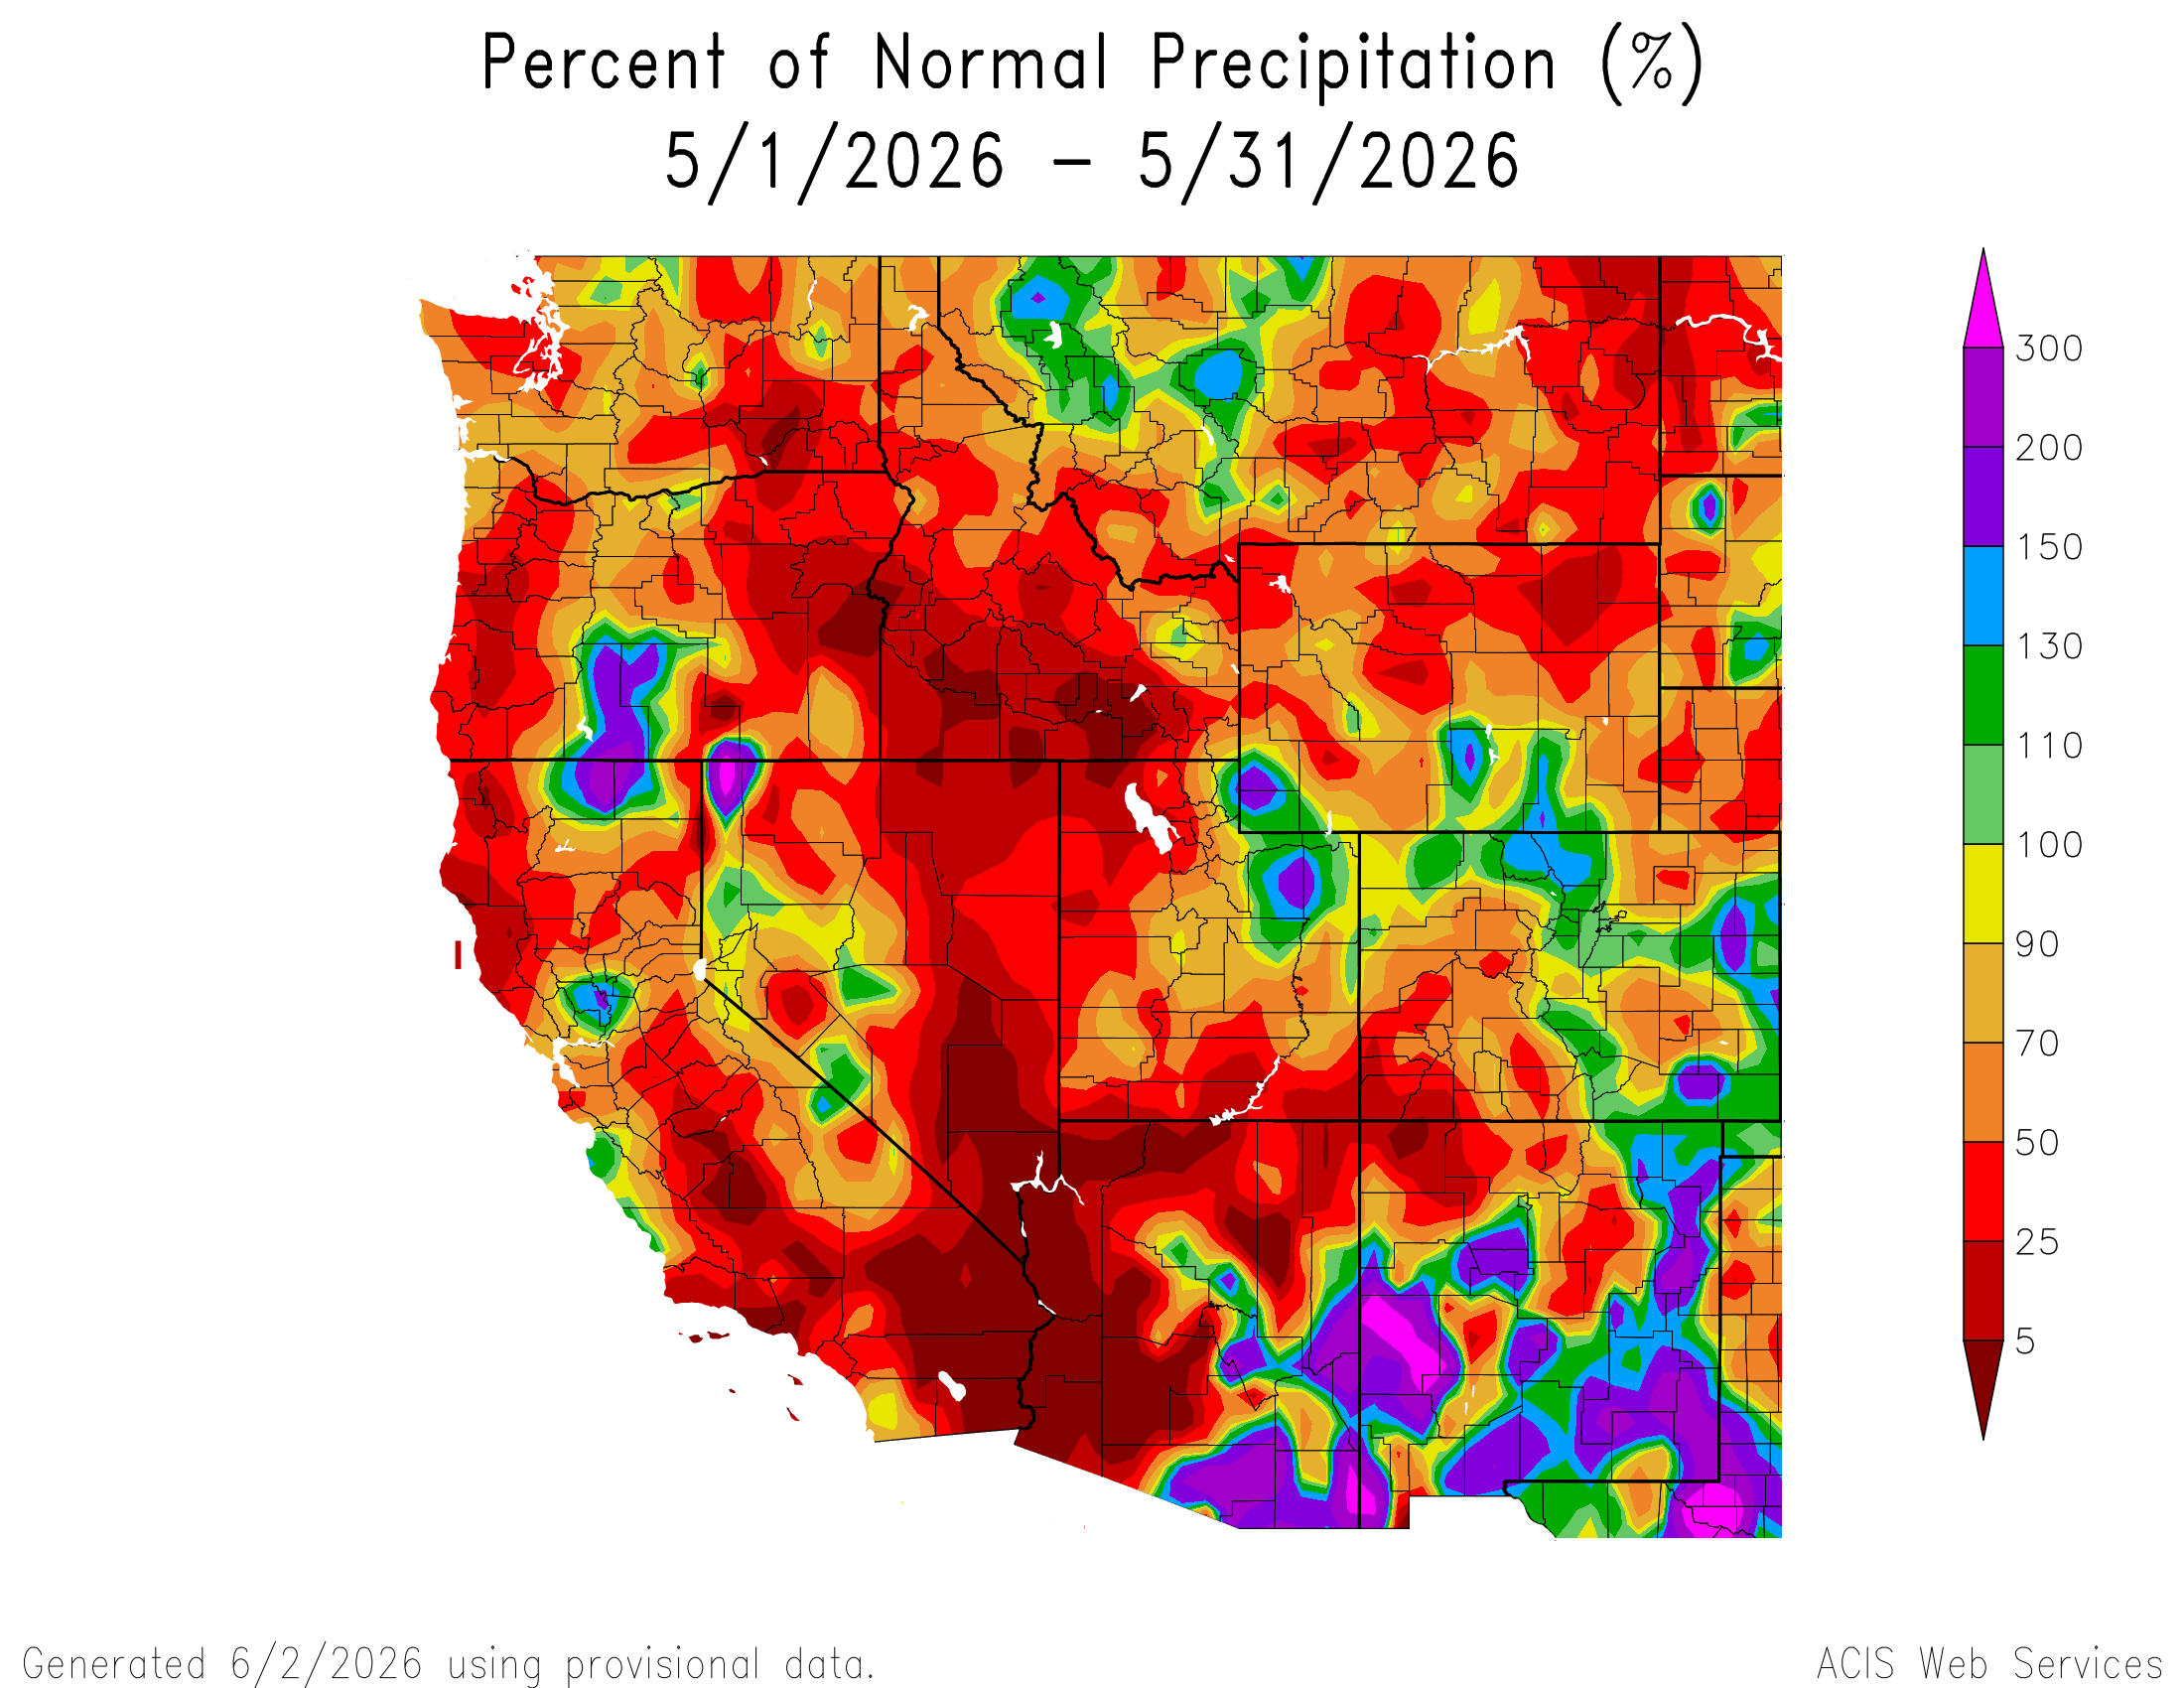
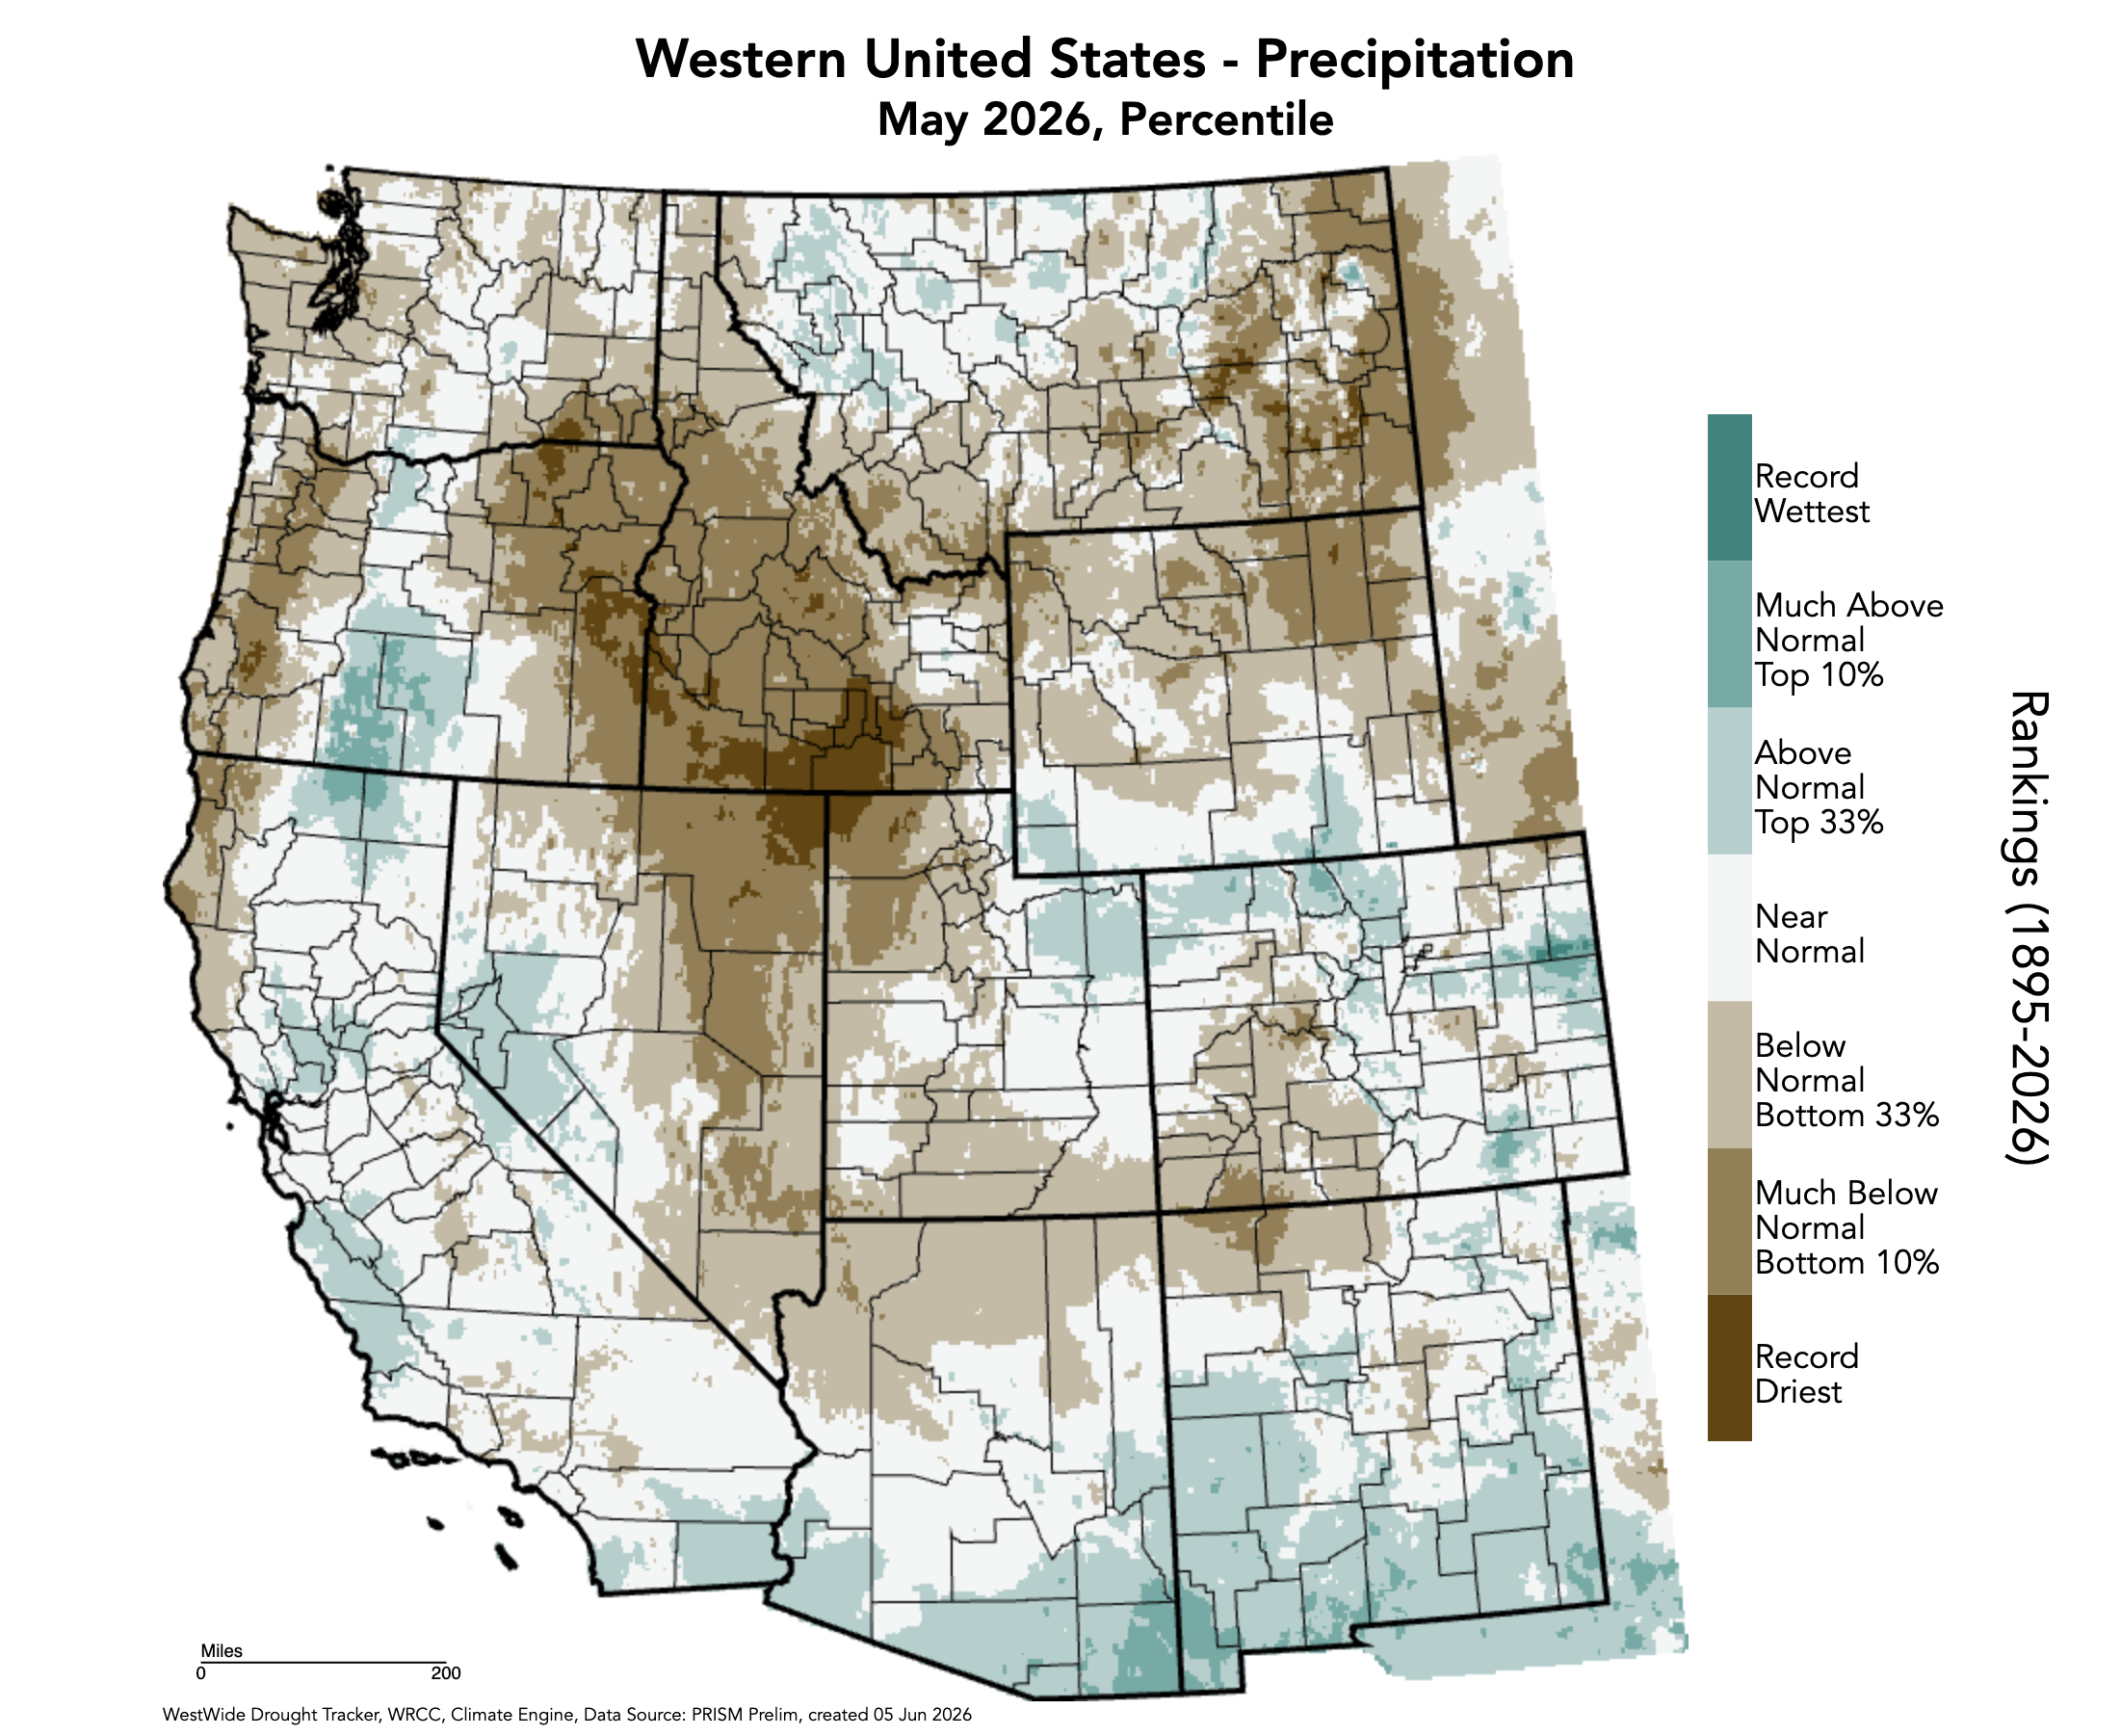
After a relatively cool April, temperatures were up to three degrees above average for much of the region during May. Temperatures in western Utah and northwestern Wyoming were 3-6ºF above average, and isolated areas of Colorado and Wyoming were up to three degrees below average during May.

June 1 snow water equivalent (SWE) remained near record-low in Colorado (14% of median), Utah (11%), and the Upper Colorado River Basin (9%), and slightly above record-low SWE in Wyoming (36%). An early May storm brought some accumulating SWE to Colorado and Utah, and a late May storm bolstered SWE slightly in Wyoming. Percent median SWE worsened during May in all river basins except the Arkansas, Little Snake, and Yampa River Basins. Snow has completely melted from all sites in the Dolores, Escalante-Sevier Lake, Lower Green, Jordan, Powder, and Upper San Juan River watersheds. Cooler conditions during April and some accumulating May snow caused SWE conditions in most river basins with remaining snowpack to improve slightly compared to record-low April 1 SWE.

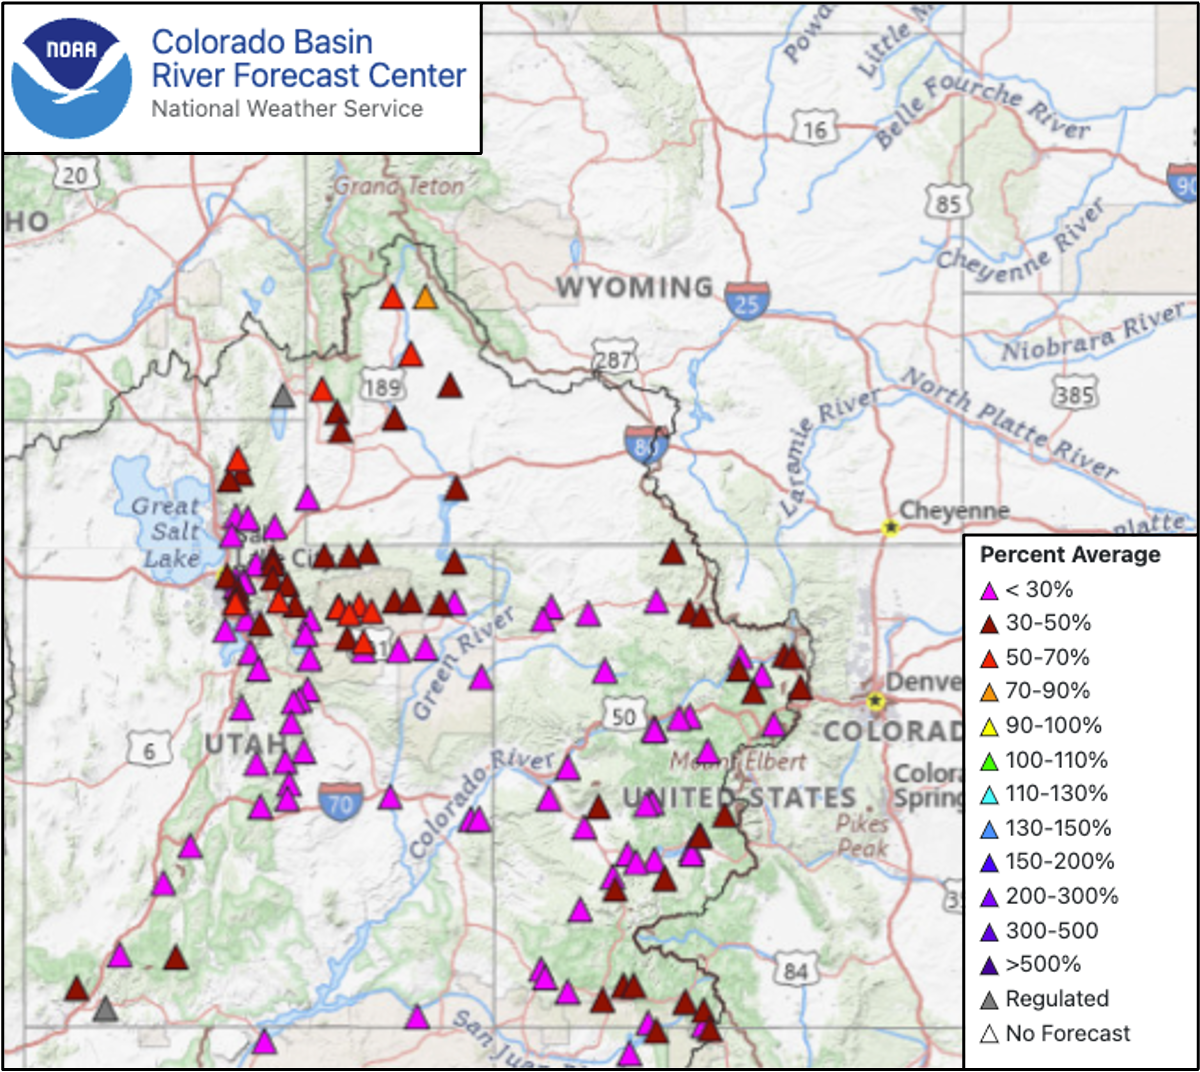
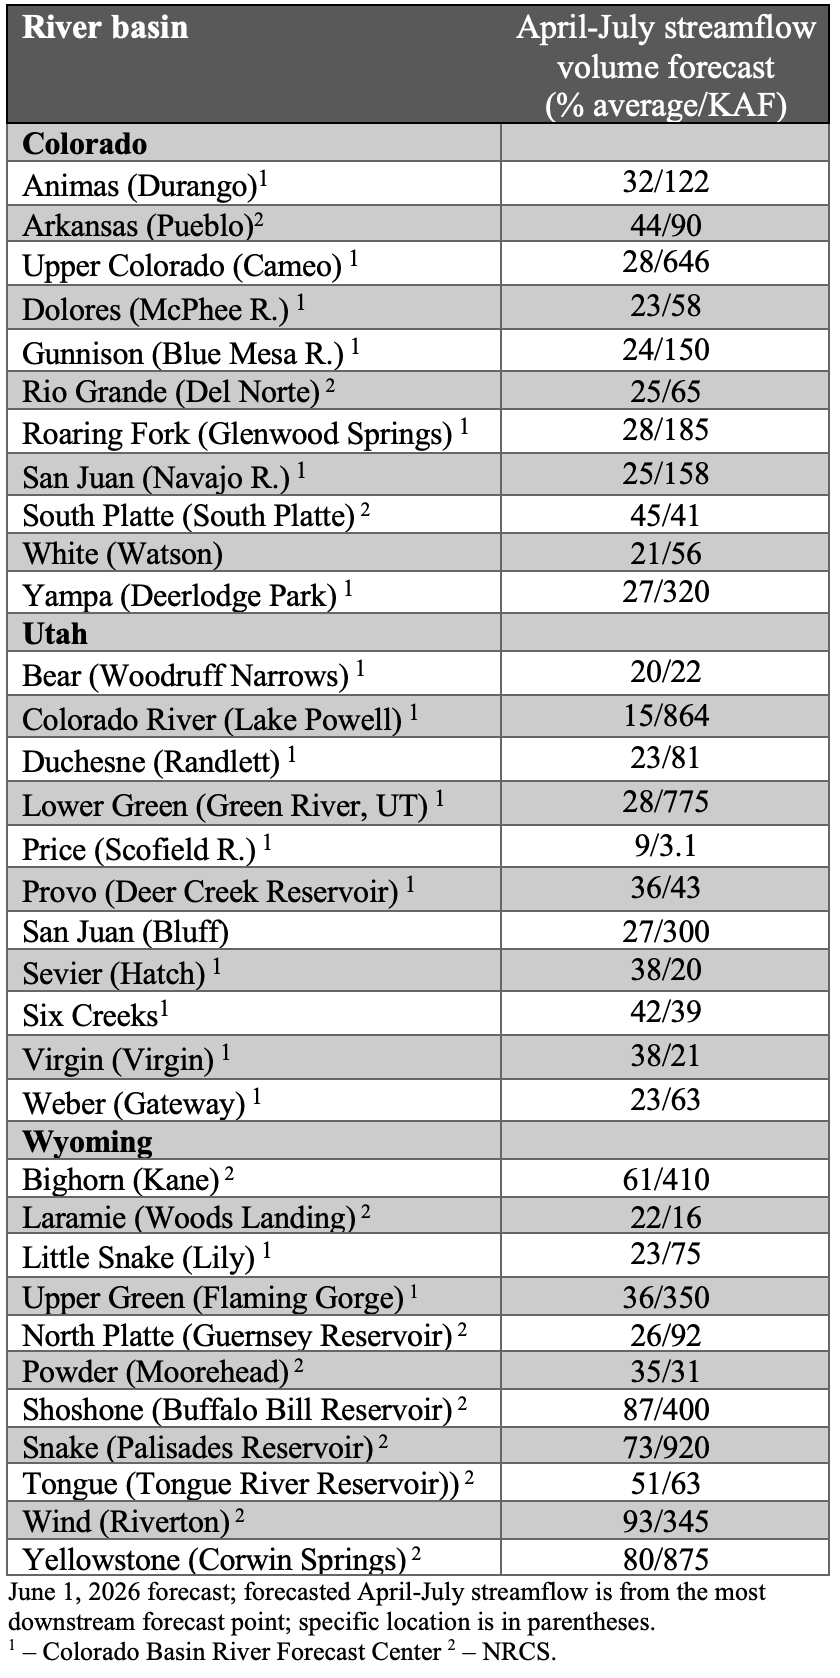
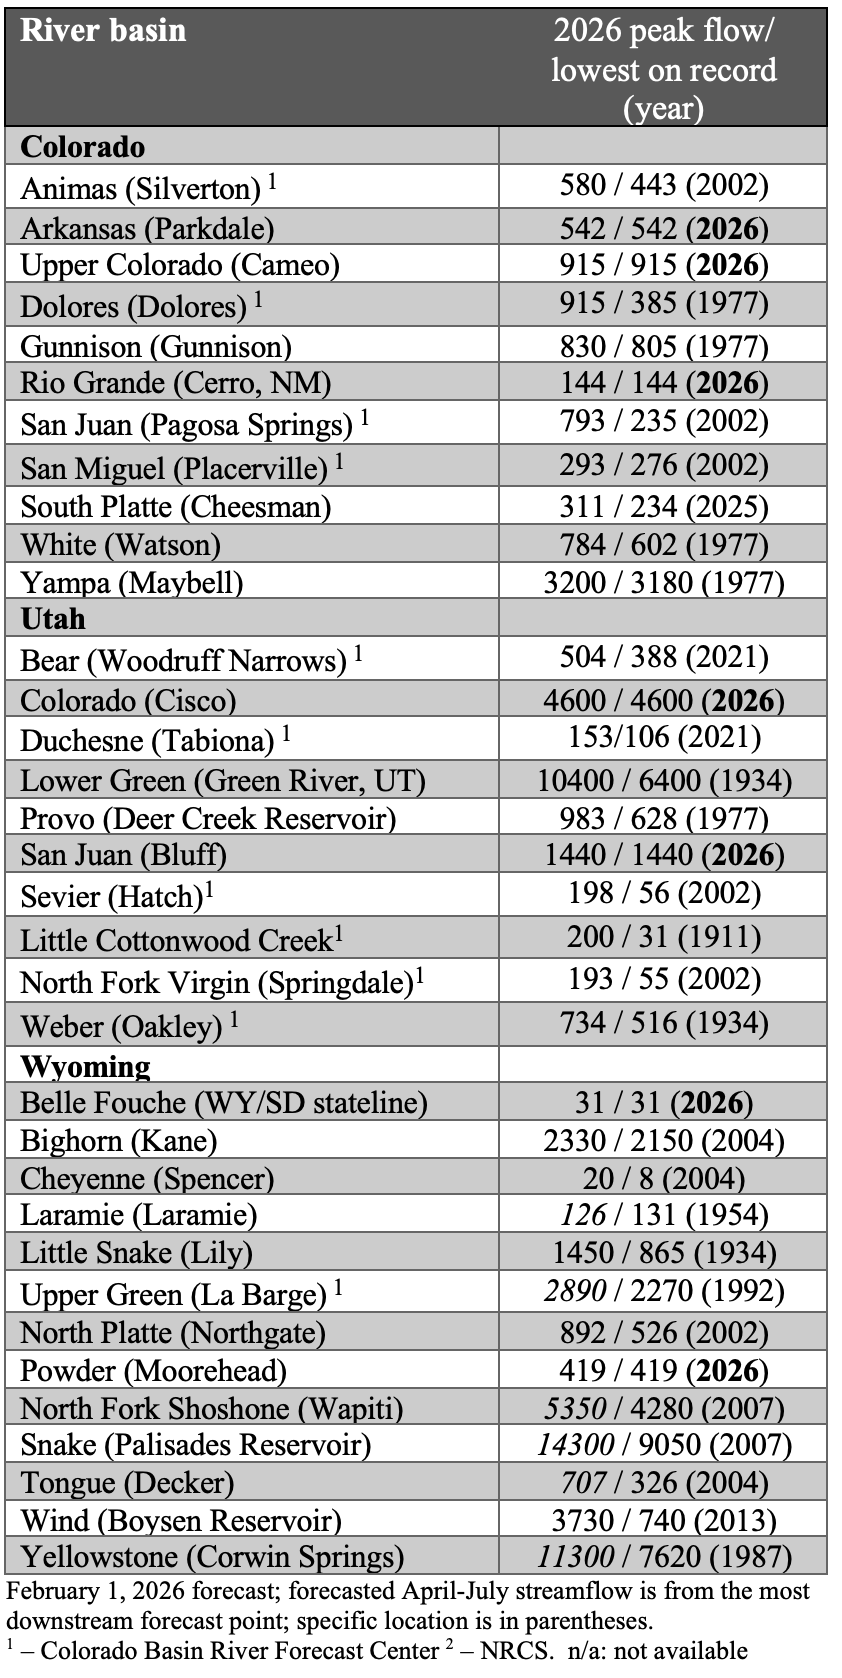
April-July streamflow volume forecasts were much below average with some basins forecasted at record-low streamflow volumes. Regional seasonal streamflow volume forecasts were less than 50% of average for all river basins except the Wind (93%), Shoshone (87%), Yellowstone (80%), Snake (73%), and Bighorn (61%) River Basins. Record-low April-July streamflow is forecasted for the Bear River (21% of average), Colorado River at Cameo (29%), Lake Powell (15%), White River (19%), and Yampa River (28%). Peak streamflow on regional rivers was extremely low to record-low. Unless a secondary peak in streamflow occurs during June or from monsoonal rains, record-low peak annual streamflow will be observed for the Arkansas, Colorado, Rio Grande, and San Juan Rivers during 2026.
Regional drought coverage decreased slightly during May and now covers 97% of the region. Extreme drought covers 41% of the region and exceptional drought encompasses the Colorado River Headwaters. Above average May rainfall in northern and eastern Colorado caused a 2-3 category improvement in drought conditions, though drought conditions still persist.
Pacific Ocean temperatures warmed to near El Niño levels, and long-term forecasts suggest a 90-98% chance of El Niño conditions forming by June-August and persisting through mid-winter. Pacific Ocean temperature models project sea surface temperatures to warm to 2 degrees Celsius above average by early 2027, potentially causing a strong El Niño. NOAA precipitation forecasts suggest an active monsoon season with an increased probability of above average precipitation during May for southern Colorado and an increased probability for above average precipitation for most of the region during June–August. NOAA seasonal forecasts suggest an increased probability of above average temperatures for June-August.


Significant May weather event. Up to three feet of snow fell on May 5-6 along the northern Front Range of Colorado and southeastern Wyoming. Estes Park and Rocky Mountain National Park saw snowfall totals from 2 to 3 feet. Cheyenne, Wyoming experienced its largest snowfall of the year with 11.6” while Boulder recorded 11” and Denver International Airport recorded 5.8”. Despite the significant snowfall in parts of Colorado and Wyoming, the storm did little to relieve persistent regional drought conditions.