February 11, 2025 - CO, UT, WY
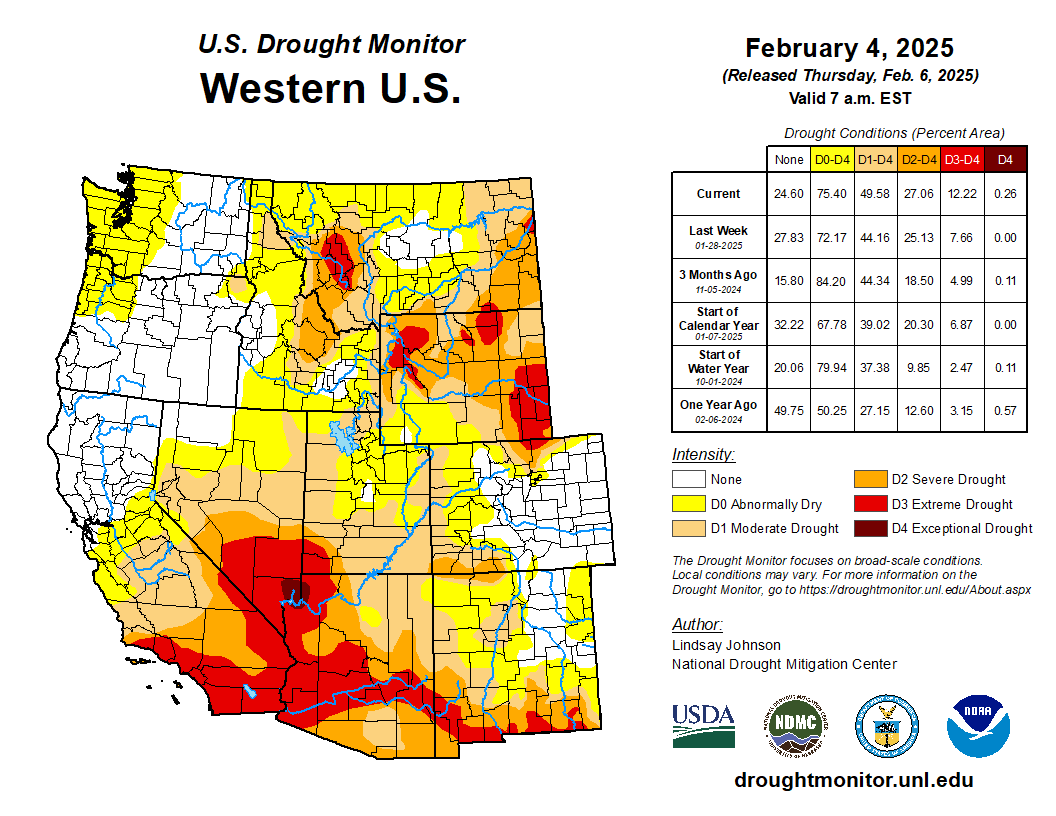
In January, precipitation varied across the region, from much below average conditions in Utah and western Colorado to much above average conditions in eastern Colorado and southeastern Wyoming. January temperatures were colder than usual, especially in Colorado and Wyoming where temperatures were 6 to 10°F below average. Snow-water equivalent (SWE) was generally below normal, particularly in southern Utah and southwestern Colorado. Seasonal streamflow forecasts for February 1st indicate below average runoff for much of the region, with the worst forecasts for Utah. Drought coverage increased across the region, affecting 56% of the region as of February 4th. La Niña conditions emerged in the Pacific Ocean but are expected to transition back to ENSO-neutral by spring 2025. NOAA seasonal forecasts for February-April suggest an increased probability of below average precipitation for the majority of the region.
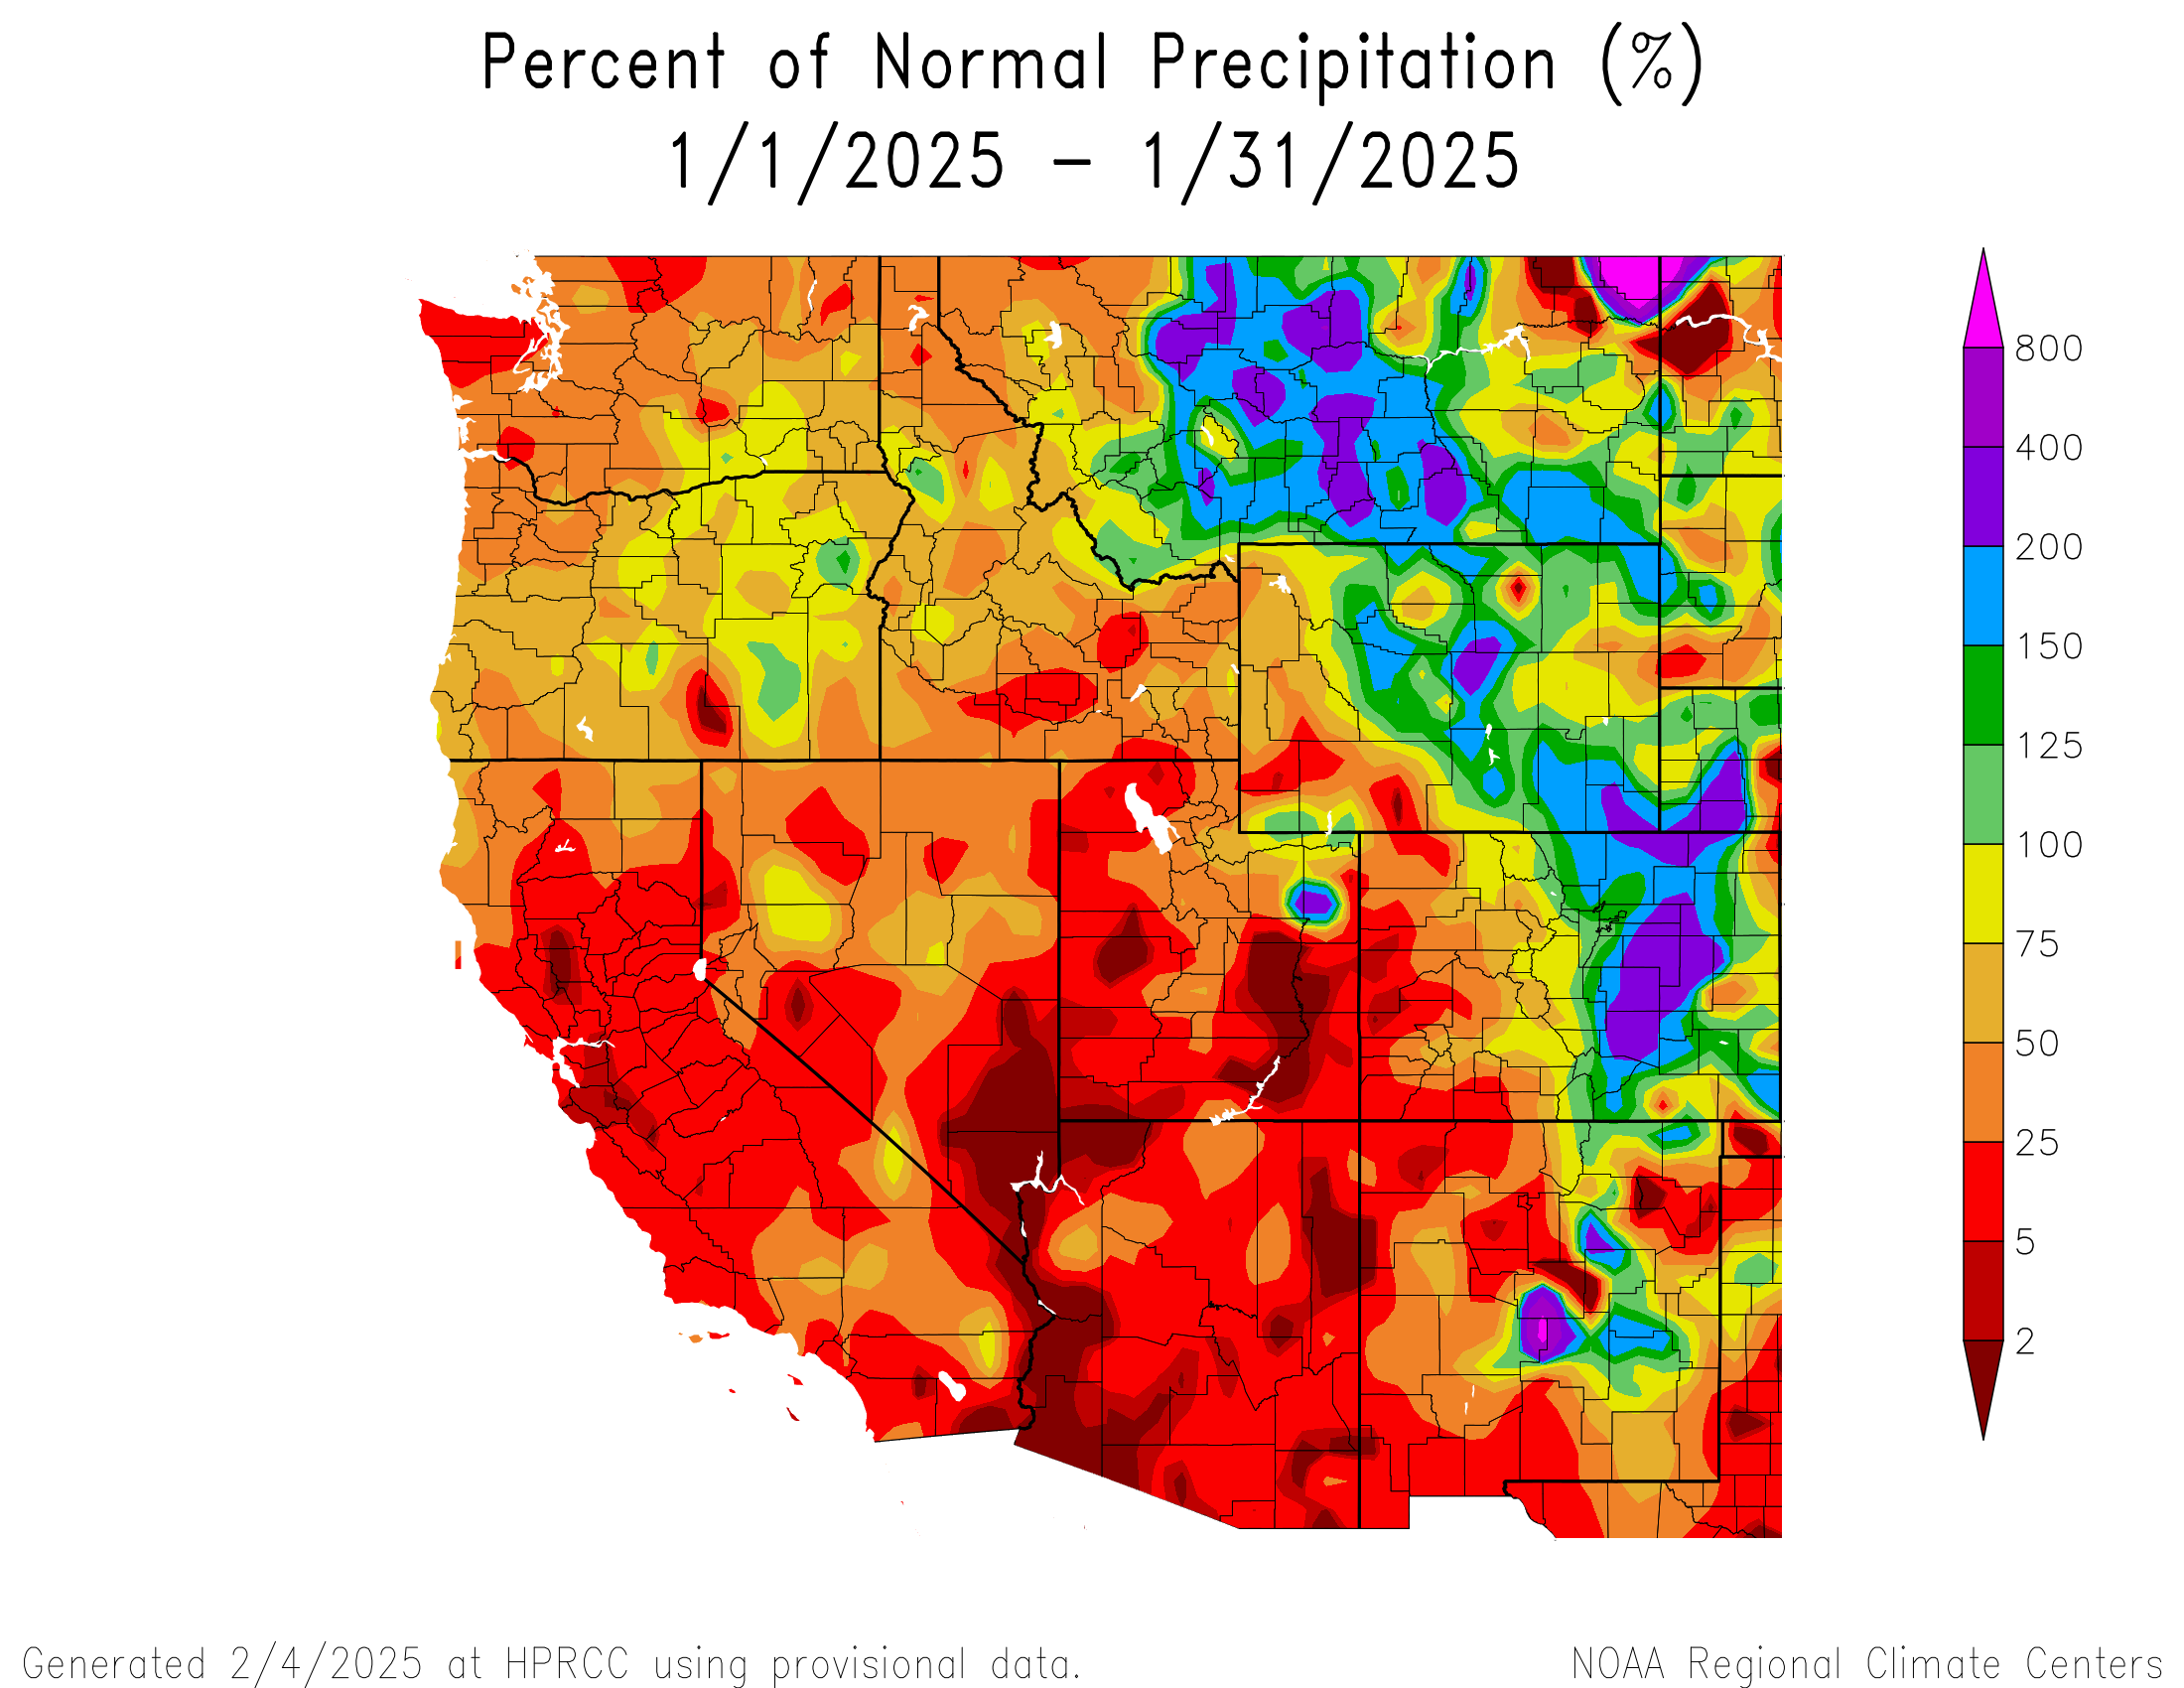
January precipitation was below to much below average in Utah, western Colorado, and southwestern Wyoming, and above to much above average in eastern Colorado and central to southeastern Wyoming. Large areas of 200-400% of average precipitation occurred from Laramie County in southeastern Wyoming down to Pueblo County in southeastern Colorado, with small pockets of 200-400% of average precipitation in Natrona County in central Wyoming and Uintah County in northeastern Utah. Large areas of less than 2% of average precipitation occurred in southern Utah. Record-dry conditions occurred across Utah and in the West Slope of Colorado.

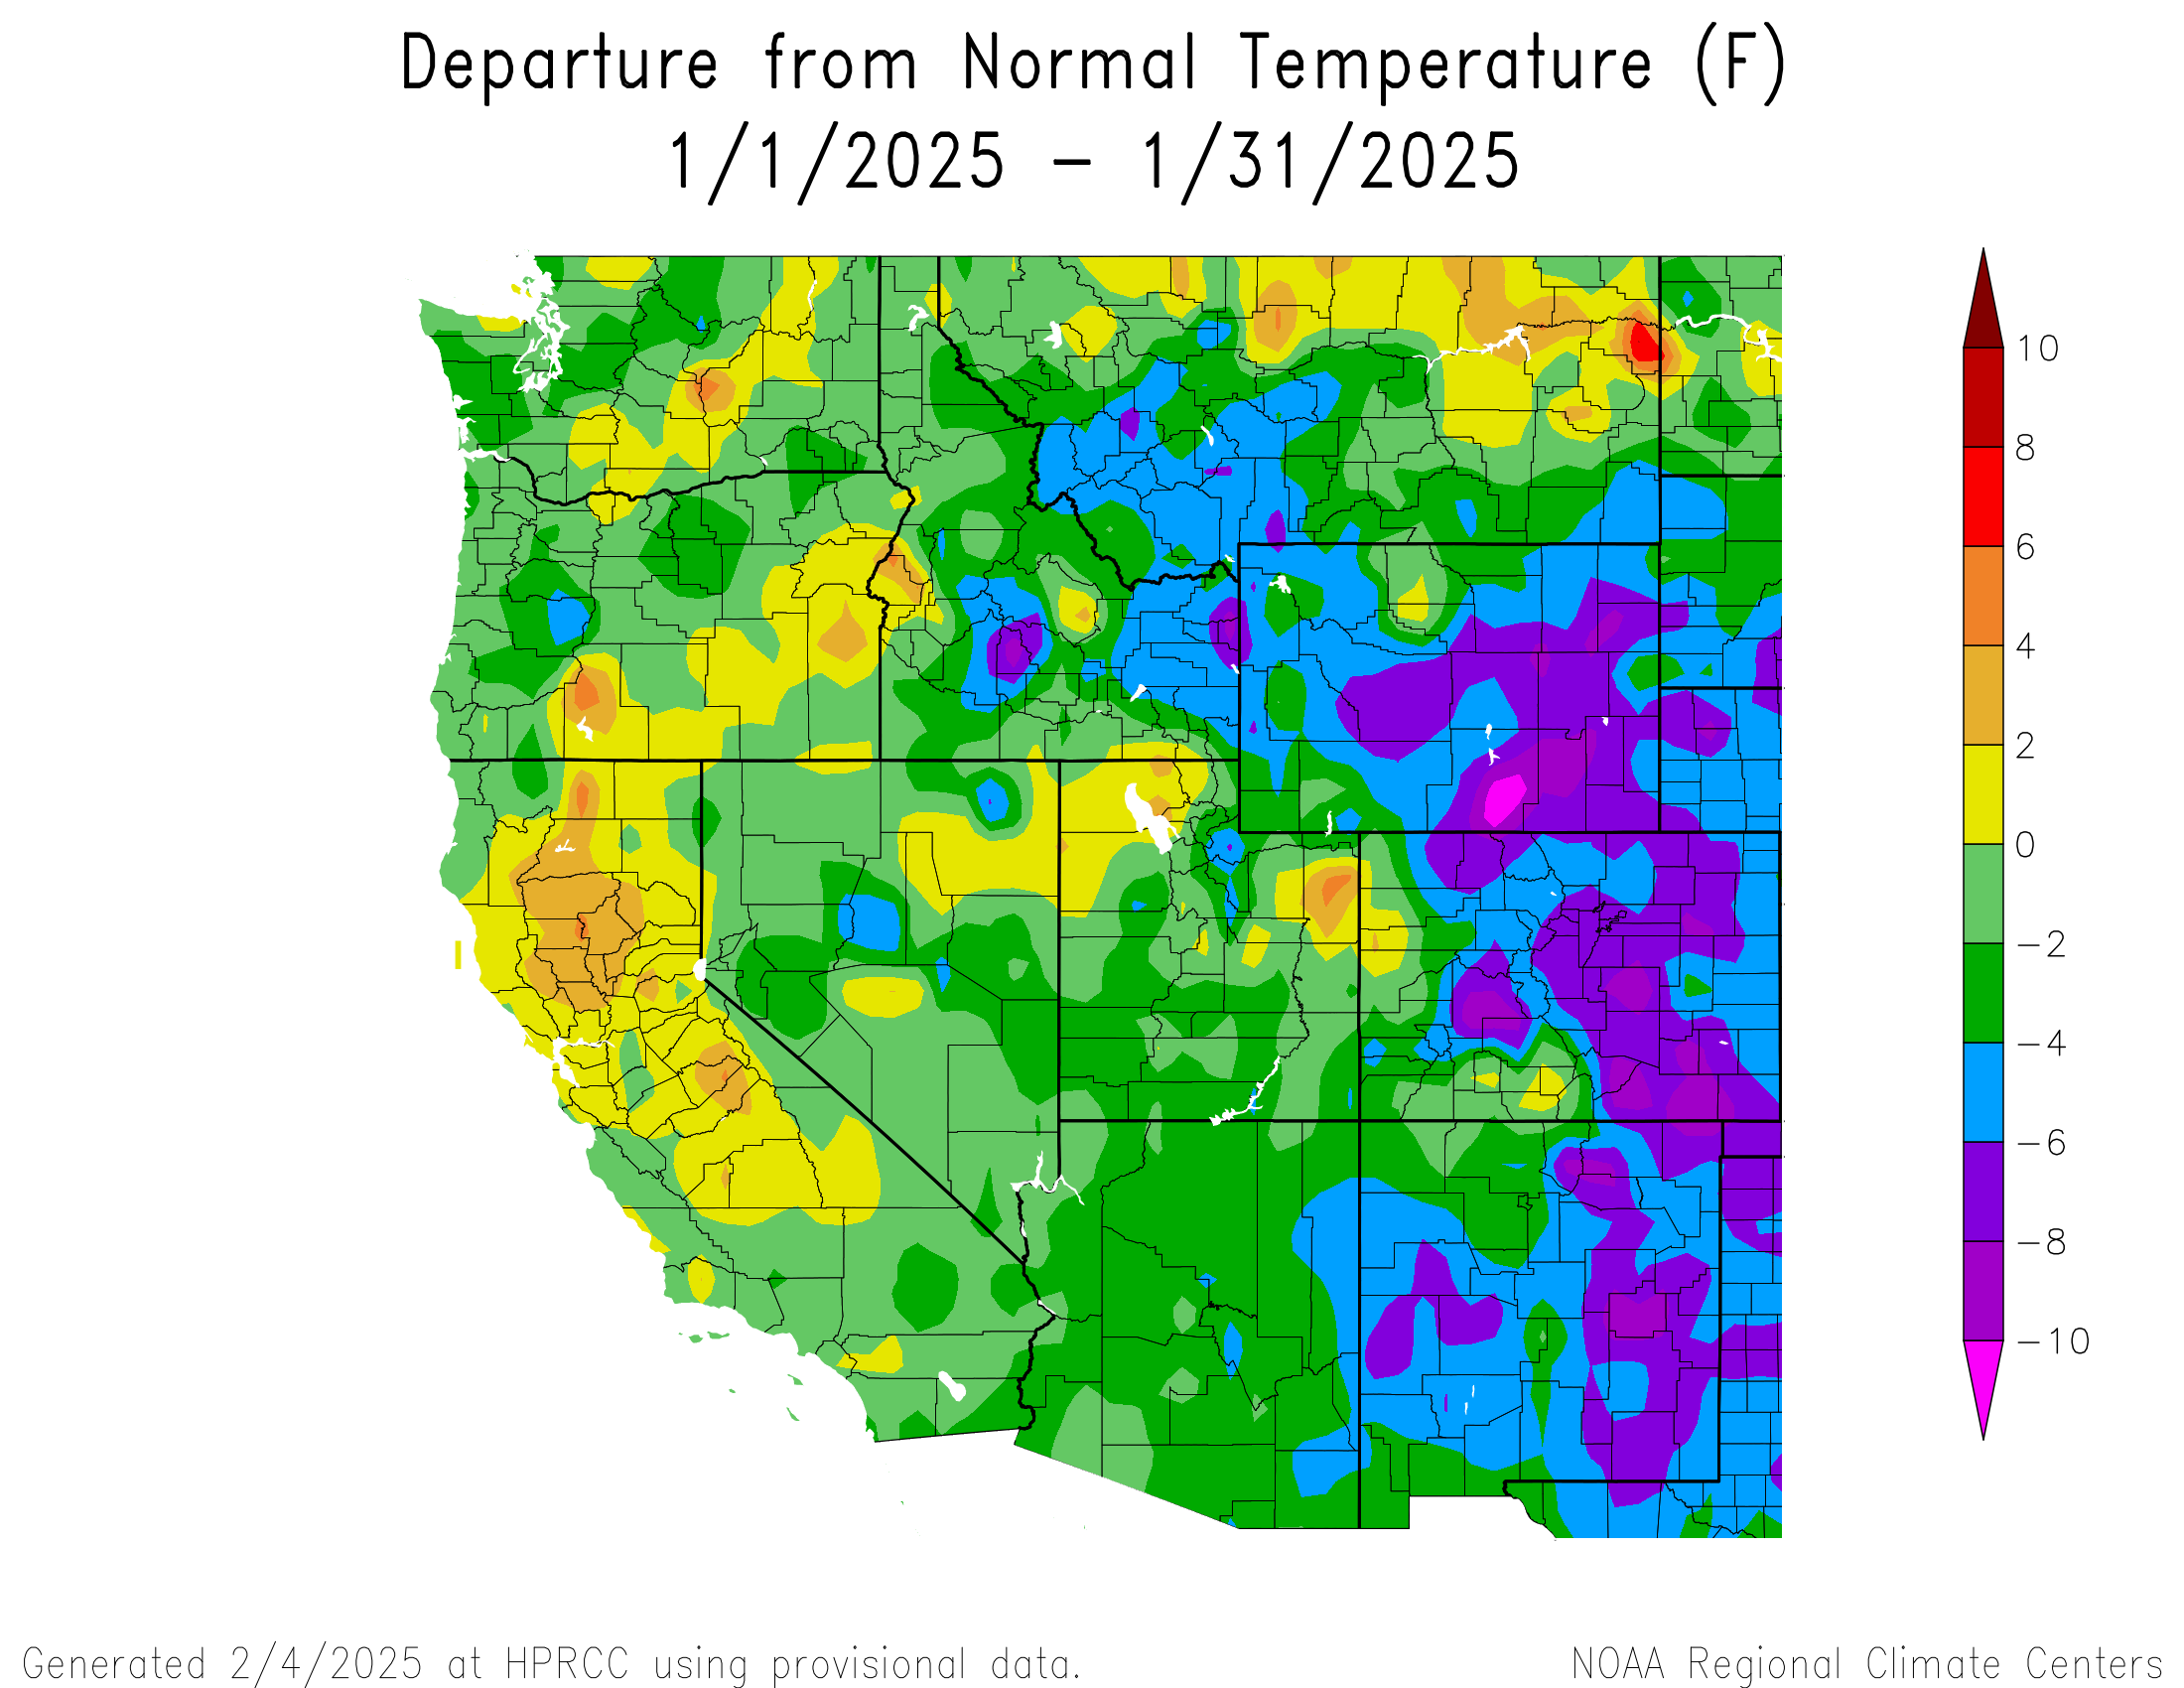
January temperatures were near to below average in Utah and below to much below average in Colorado and Wyoming. Temperatures of 6 to 8°F below average occurred throughout most of Colorado and Wyoming with scattered pockets of 8 to 10°F below average. One pocket of lower than 10°F below average temperatures occurred in Carbon County in southern Wyoming.

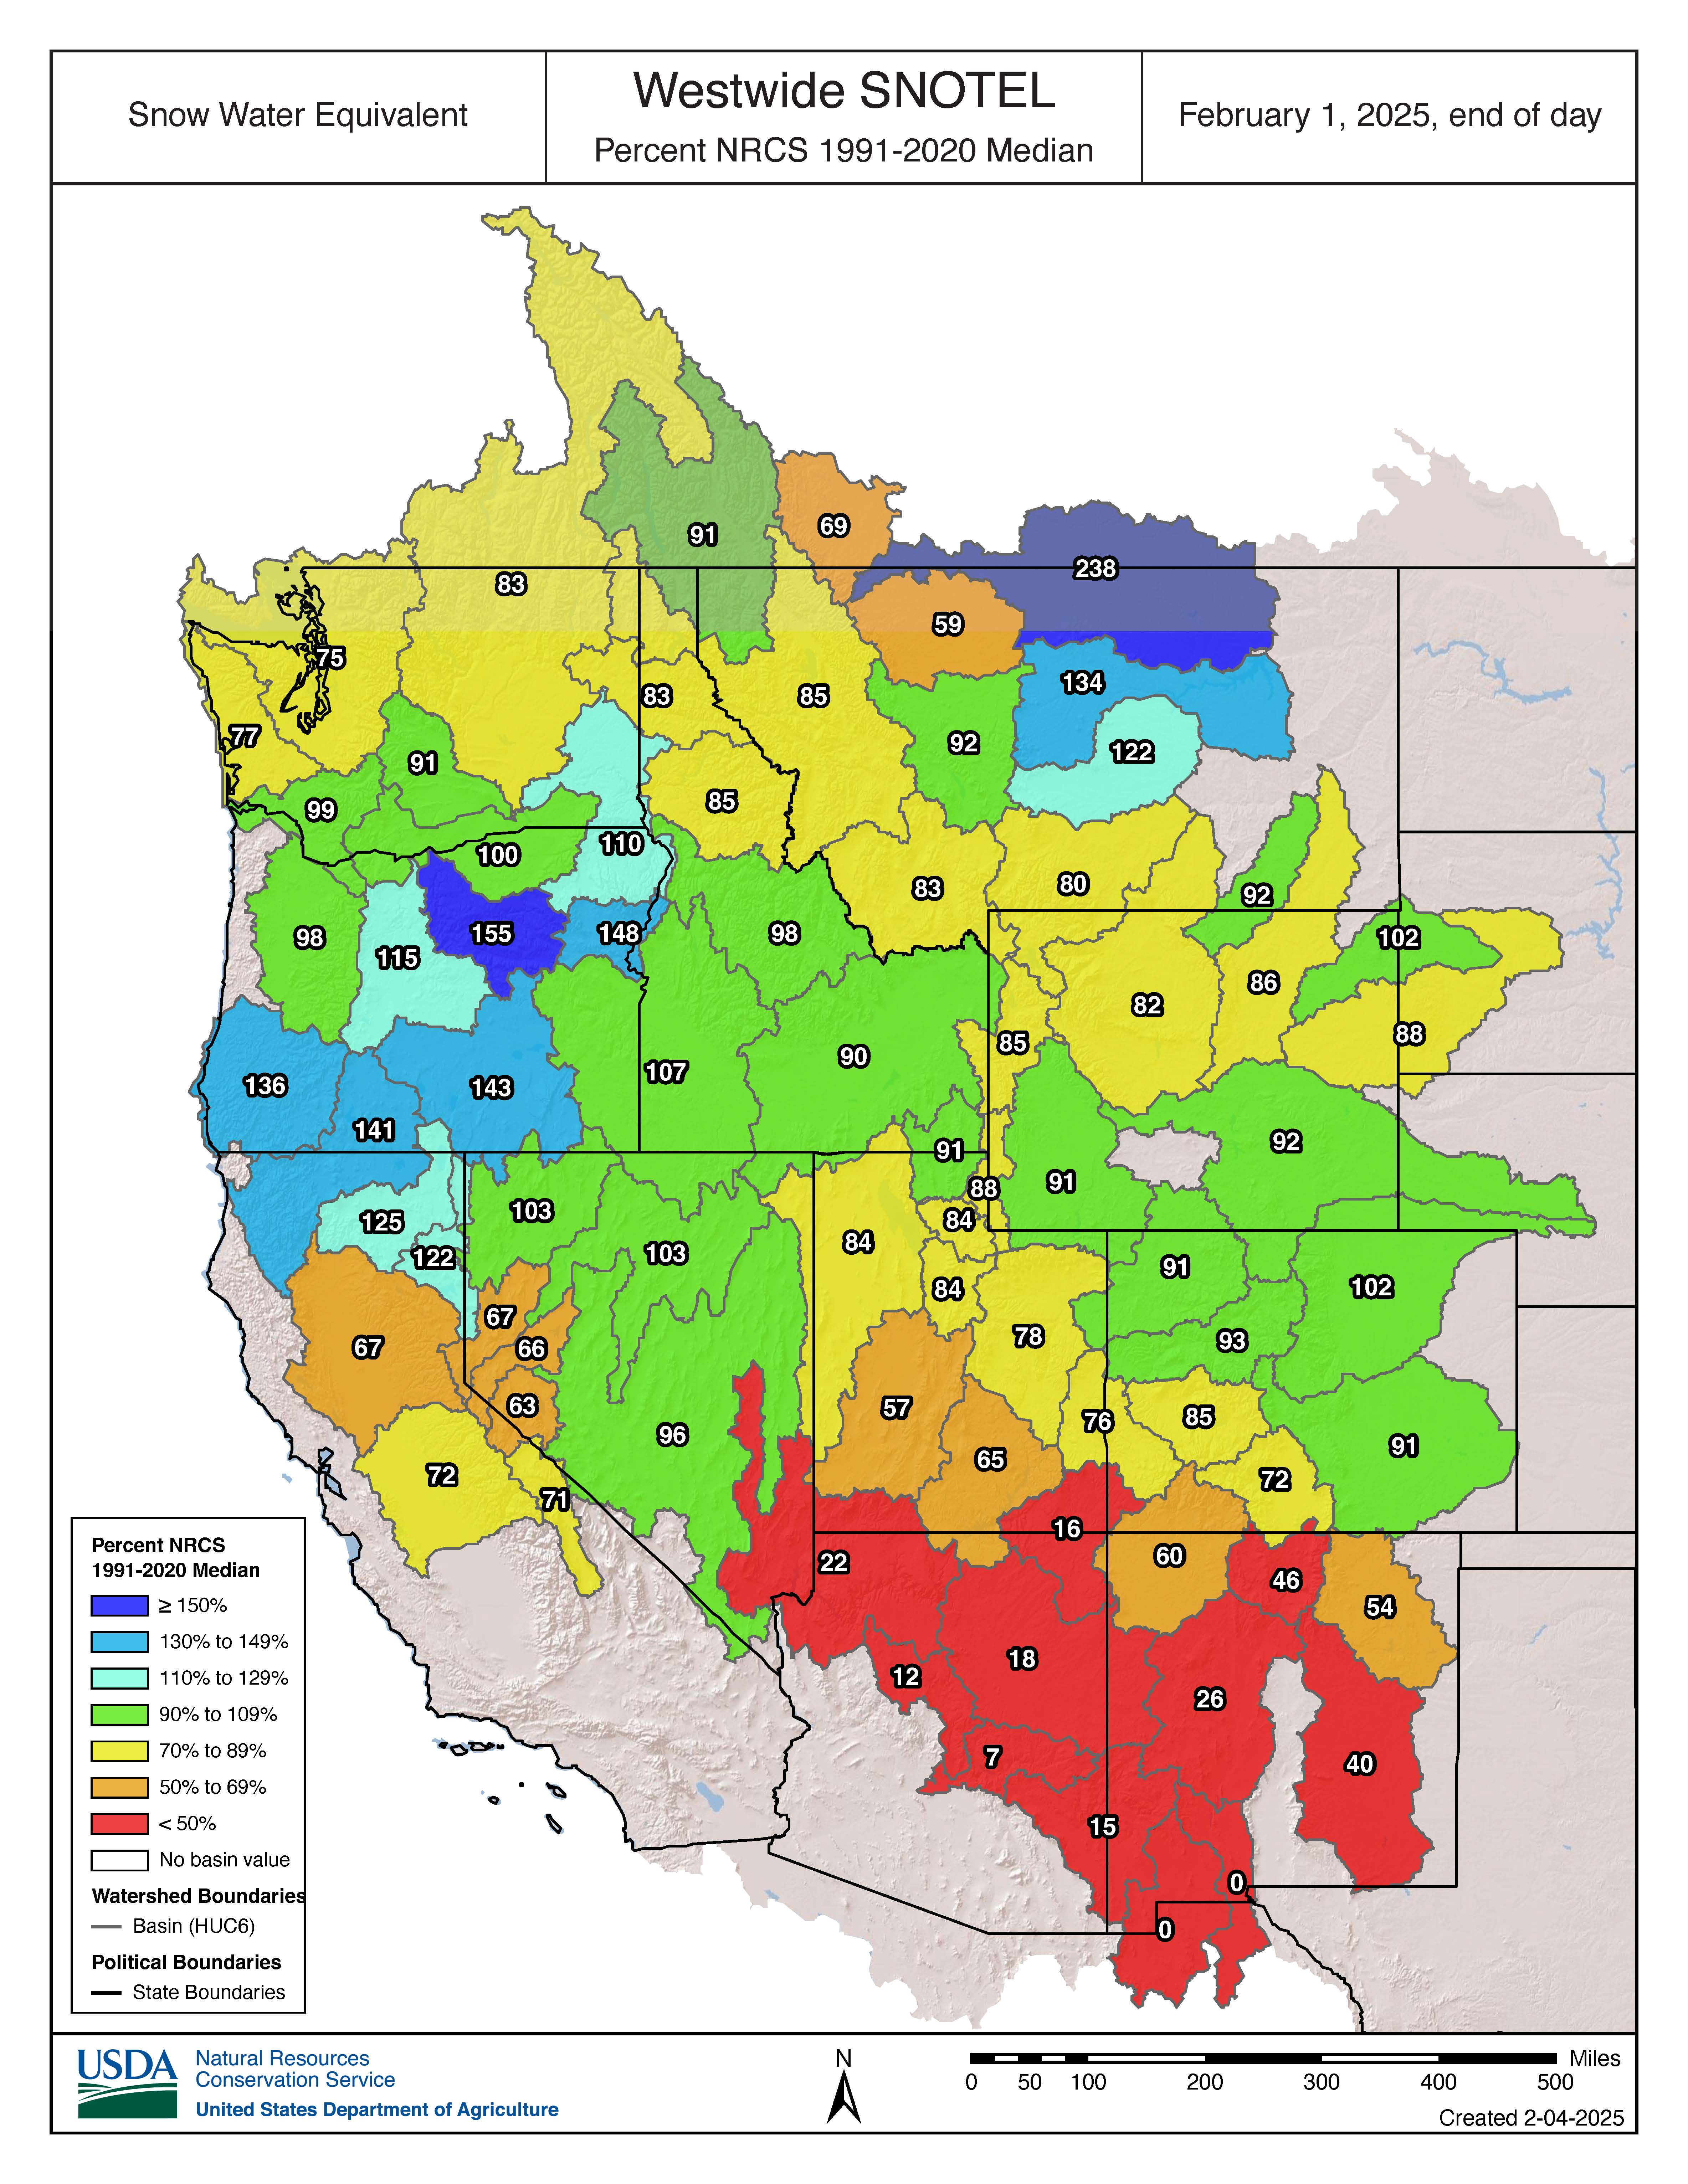
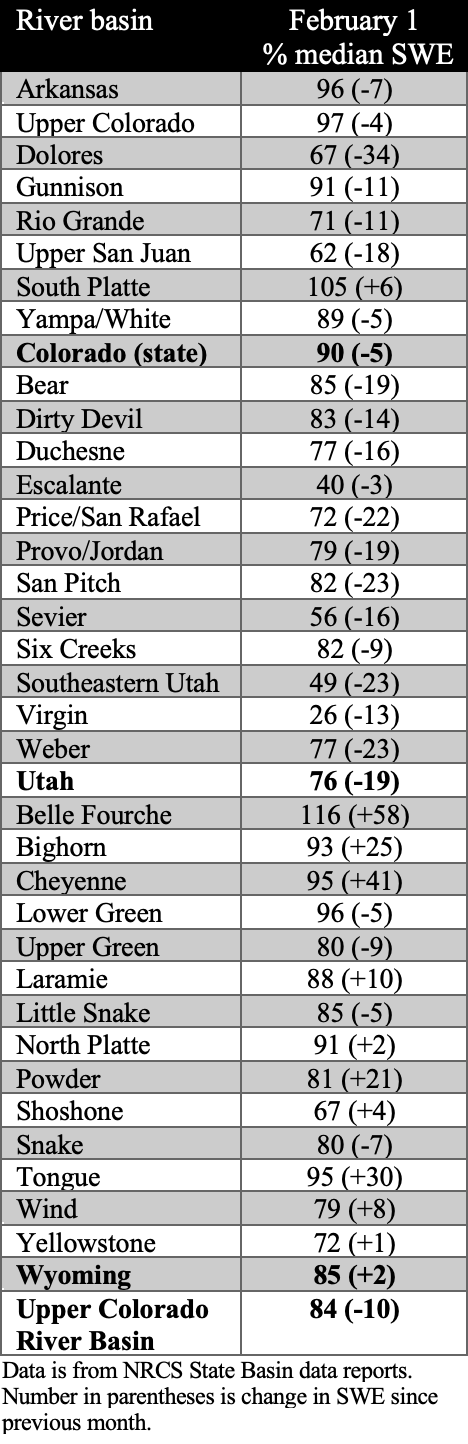
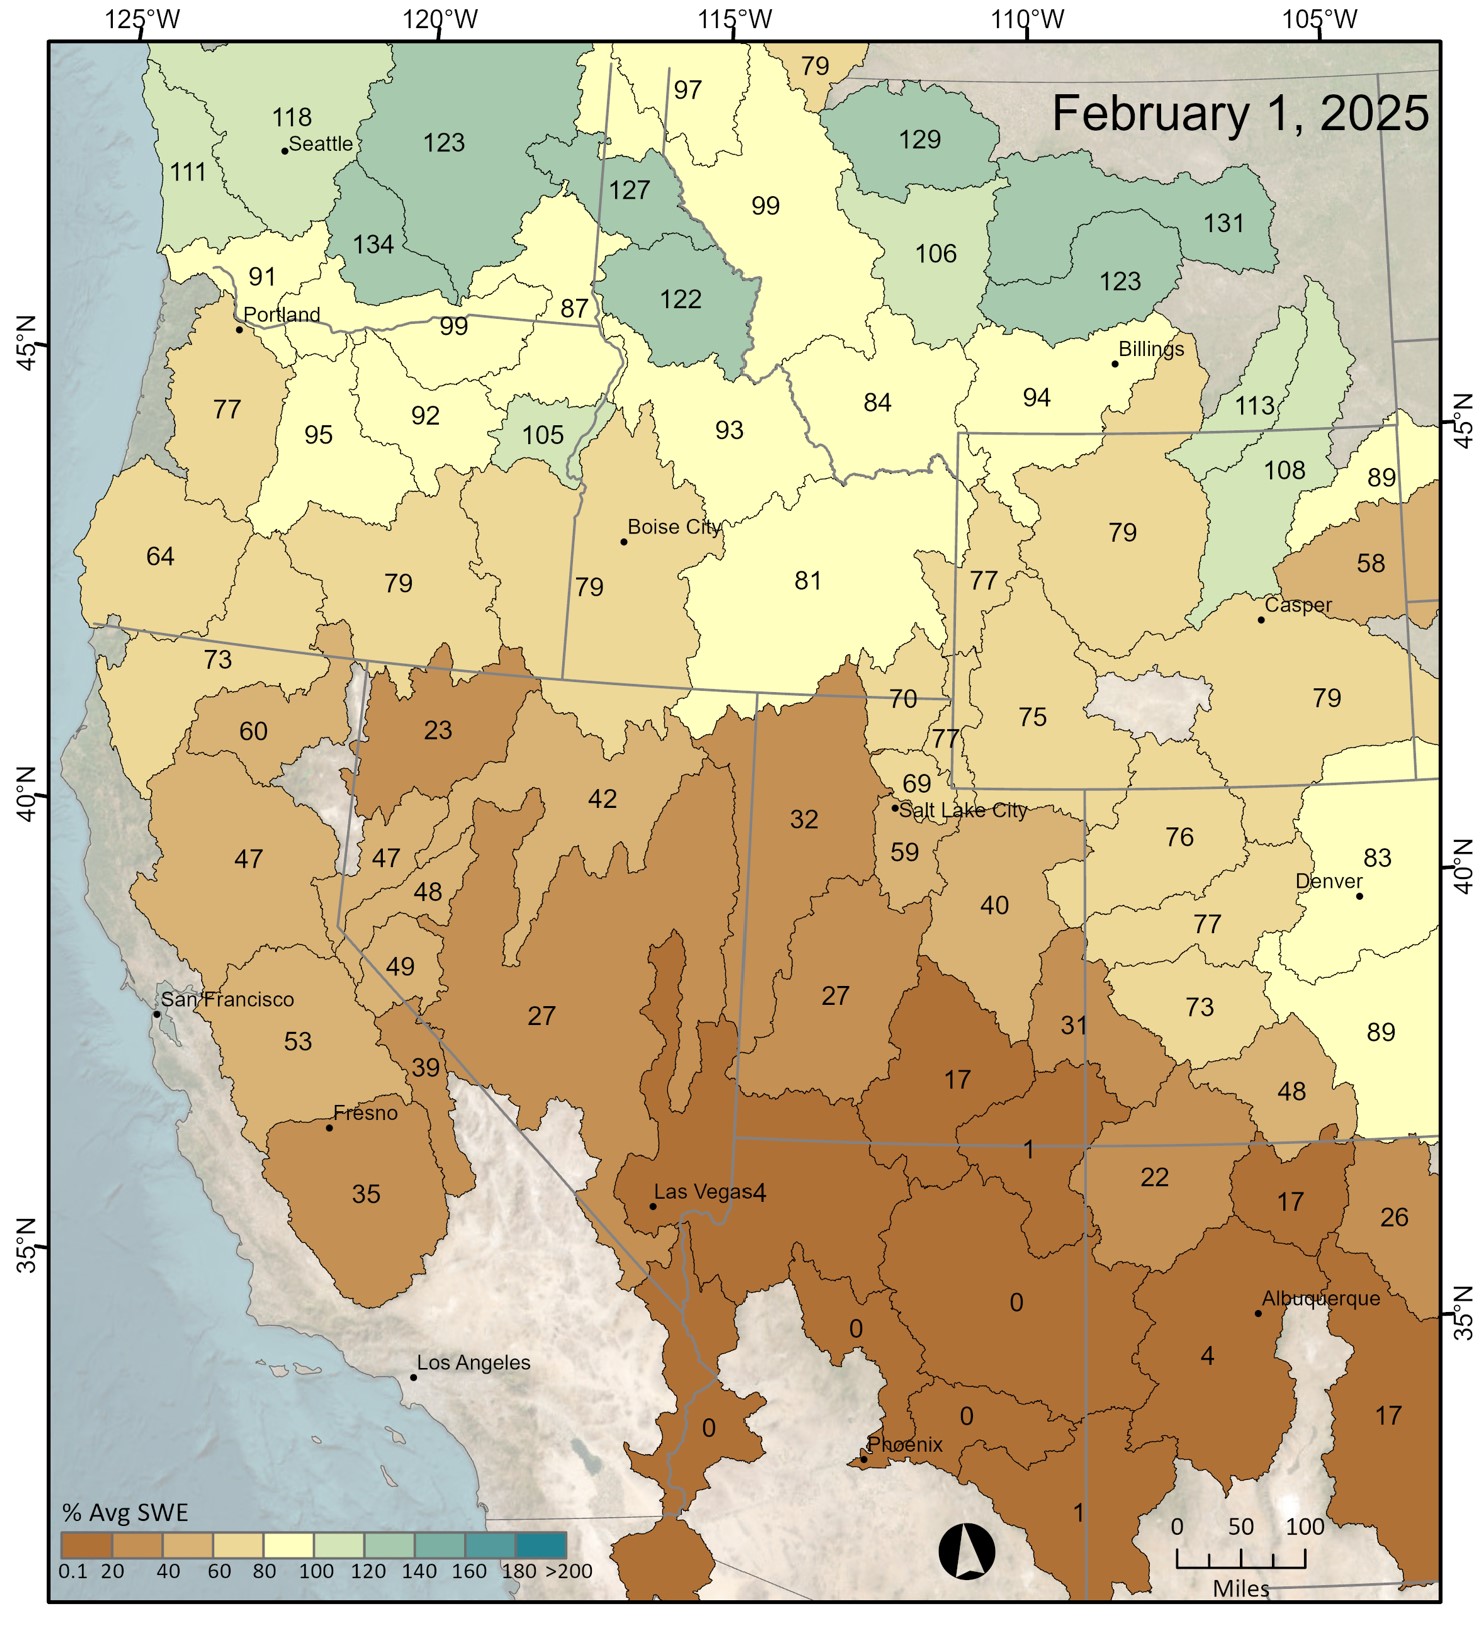
Snow-water equivalent (SWE) was near to below normal for the majority of the region, with much below normal conditions in southern Utah and southwestern Colorado. The majority of river basins in Colorado and Utah saw a significant decrease in SWE conditions relative to median during January, whereas many Wyoming river basins saw a significant increase, particularly the Belle Fourche, Cheyenne, Tongue, Bighorn, and Powder River Basins. On a statewide basis, February 1st SWE conditions in Colorado were near normal (90%) and below normal in Wyoming (85%) and Utah (76%). Southern Utah is still experiencing the worst snow drought conditions with the Virgin River Basin at 26% of normal and the Escalante River Basin at 40% of normal. According to the Real-Time Spatial Estimates of Snow-Water Equivalent (SWE) tool, all major river basins in the region have below average February 1 SWE except for the Tongue and Powder River Basins in Wyoming which are slightly above average at 113% and 108%, respectively. The Lower Colorado and Lower San Juan River Basins in southern Utah are experiencing the lowest average SWE at 4% and 1%, respectively.
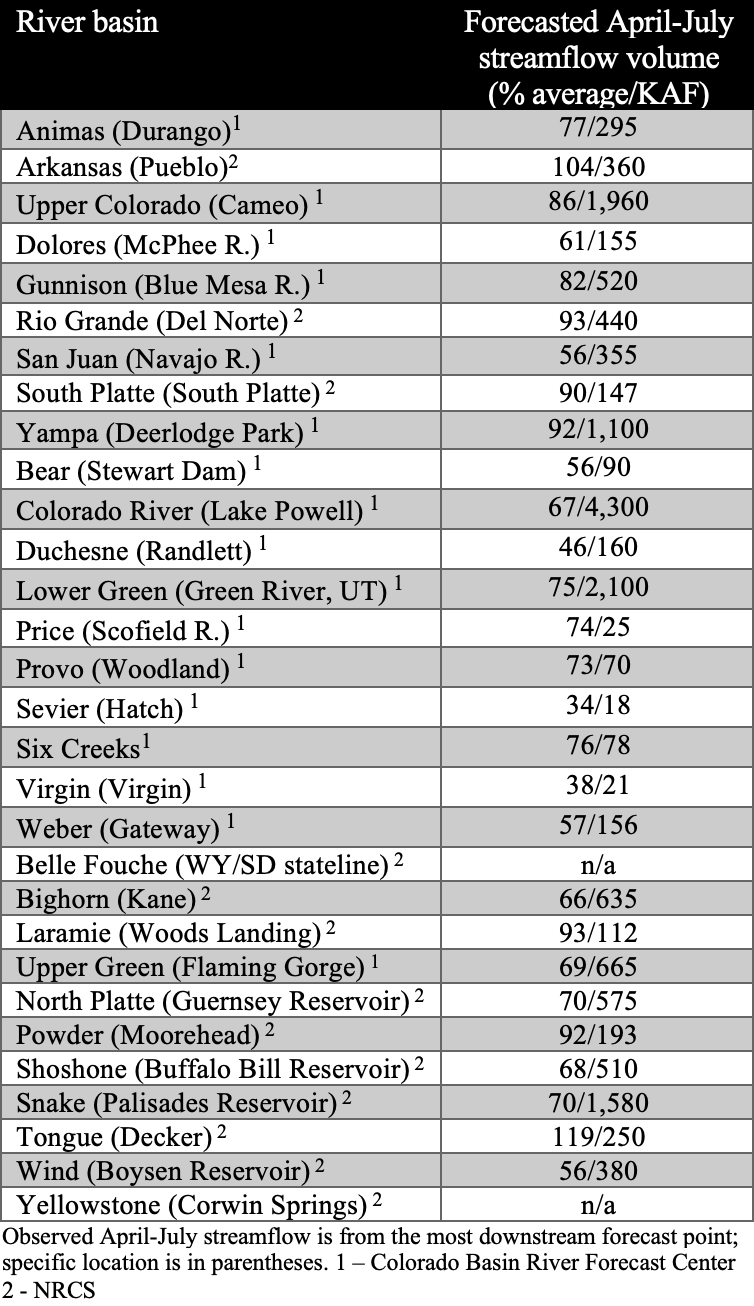
February 1st seasonal streamflow forecasts suggest below average runoff throughout much of the region, with much below average runoff in Utah, and near average runoff in eastern Colorado and northeastern Wyoming. In Colorado, seasonal streamflow forecasts for the Animas, Upper Colorado, and Gunnison are below average (70-89%), and the Dolores and San Juan River Basins are much below average (50-69%). In Utah, seasonal streamflow forecasts for the Lower Green, Price, Provo, and Six Creeks are below average and the Bear, Colorado, and Weber are much below average, with exceptionally below average forecasts for the Duchesne, Sevier, and Virgin River Basins (<50%). In Wyoming, seasonal streamflow forecasts for the North Platte and Snake are below average and the Bighorn, Upper Green, Shoshone, and Wind River Basins are much below average.

Regional drought coverage increased in January and now, as of February 4th, covers 56% of the region, compared to 39% in early January. Drought coverage nearly quadrupled in Utah and doubled in Colorado, while Wyoming saw a slight decrease in drought coverage. In Colorado, moderate (D1) drought expanded in the West Slope and severe (D2) drought developed in the southwest. In Utah, D1 drought expanded across the state, D2 drought expanded in the southwest, and extreme (D3) drought developed in the southwest. Despite Wyoming still experiencing over 80% drought coverage, there was a slight improvement in drought conditions across the state in January.

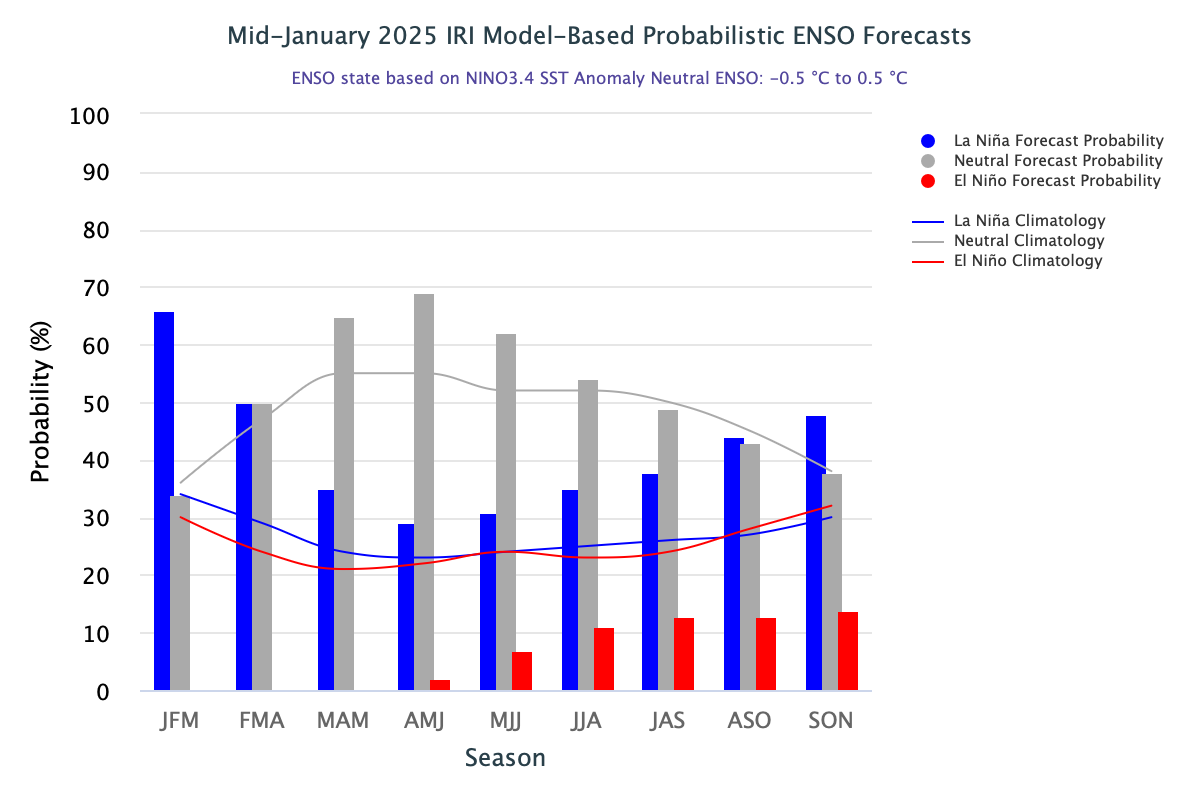
After many months of ENSO-neutral conditions, La Niña conditions emerged during January. These conditions will most likely be short-lived as there is a 60-70% probability of ENSO-neutral conditions emerging by spring 2025. NOAA monthly forecasts for February suggest an increased probability of above average precipitation for northern Utah and western Wyoming, above average temperatures for southeastern Utah and southwestern Colorado, and below average temperatures for northeastern Wyoming. NOAA seasonal forecasts for February-April suggest an increased probability of below average precipitation for the majority of the region, below average temperatures for northern and eastern Wyoming, and above average temperatures for southern Utah and southwestern Colorado.


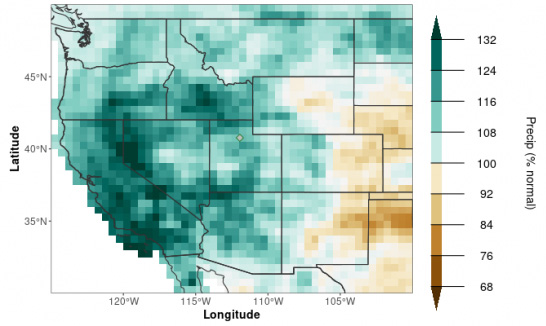
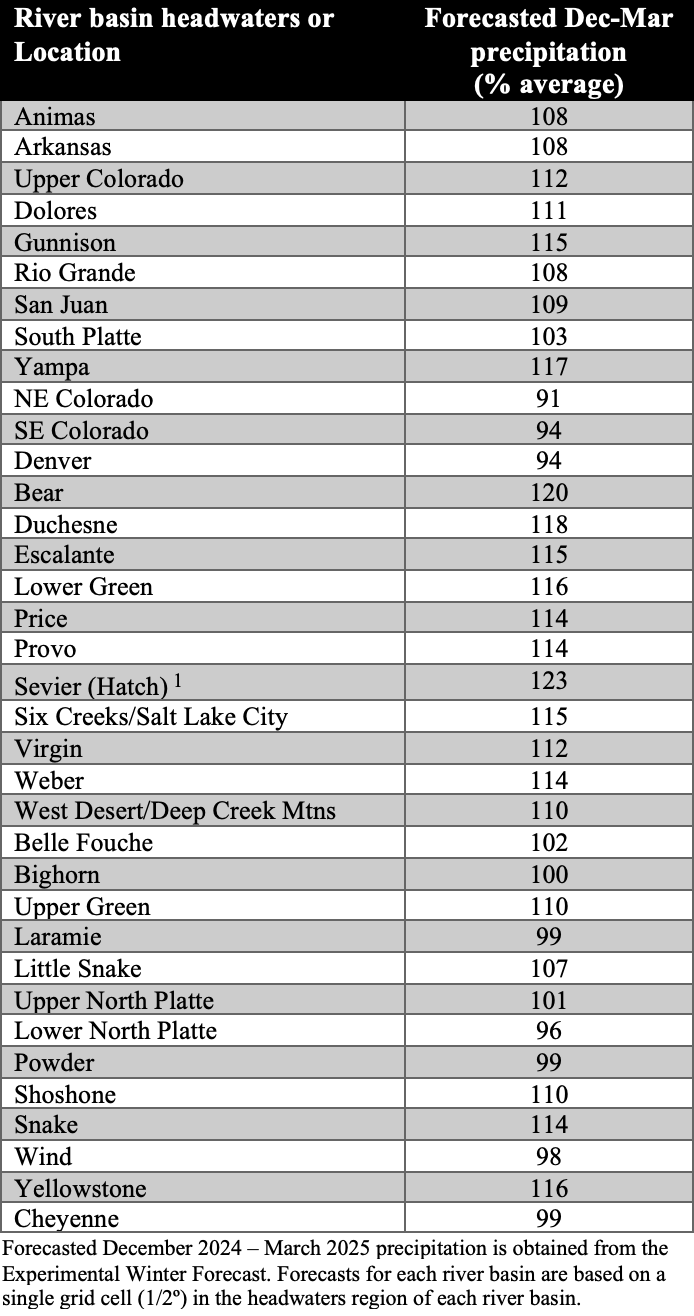
The new Experimental Winter Forecast predicts December-March precipitation in the western United States using Pacific and Atlantic Ocean temperatures. The most current forecast uses October-December ocean temperatures and indicates slightly above average winter precipitation for much of the region. The regional pattern of precipitation reflects average Pacific Ocean and warm Atlantic Ocean temperatures. Slightly above average winter precipitation is forecasted for most of the region with the highest precipitation relative to average in southern Utah and the lowest in central Wyoming and eastern Colorado.
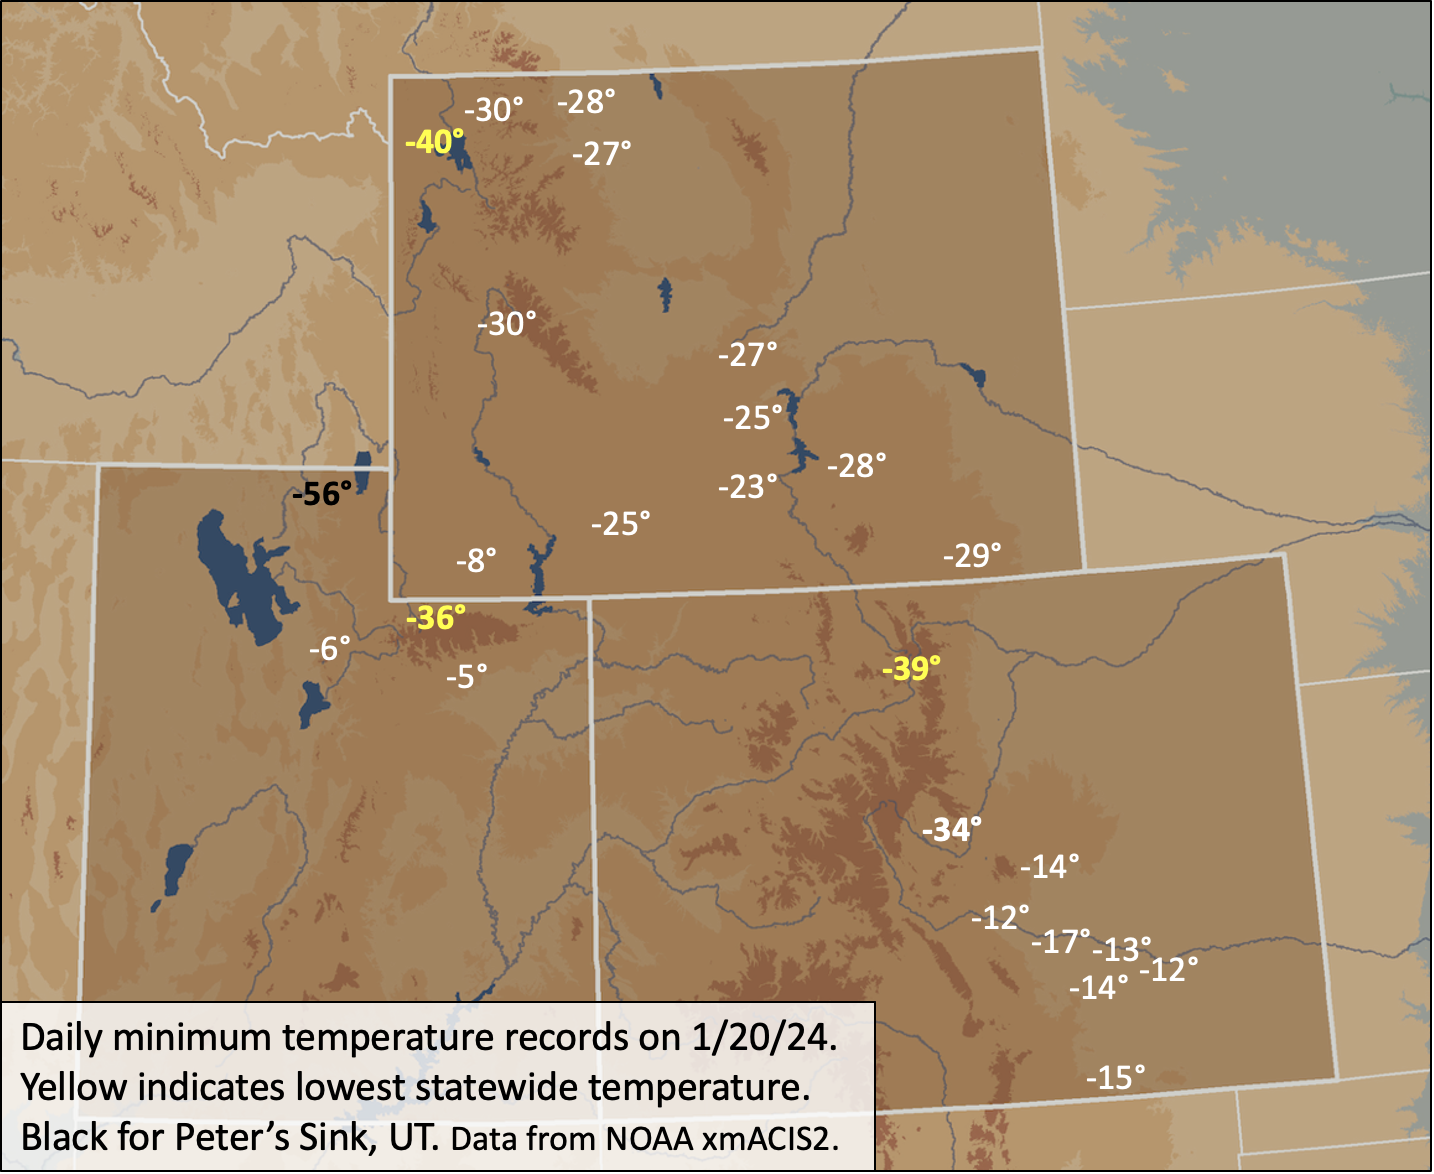
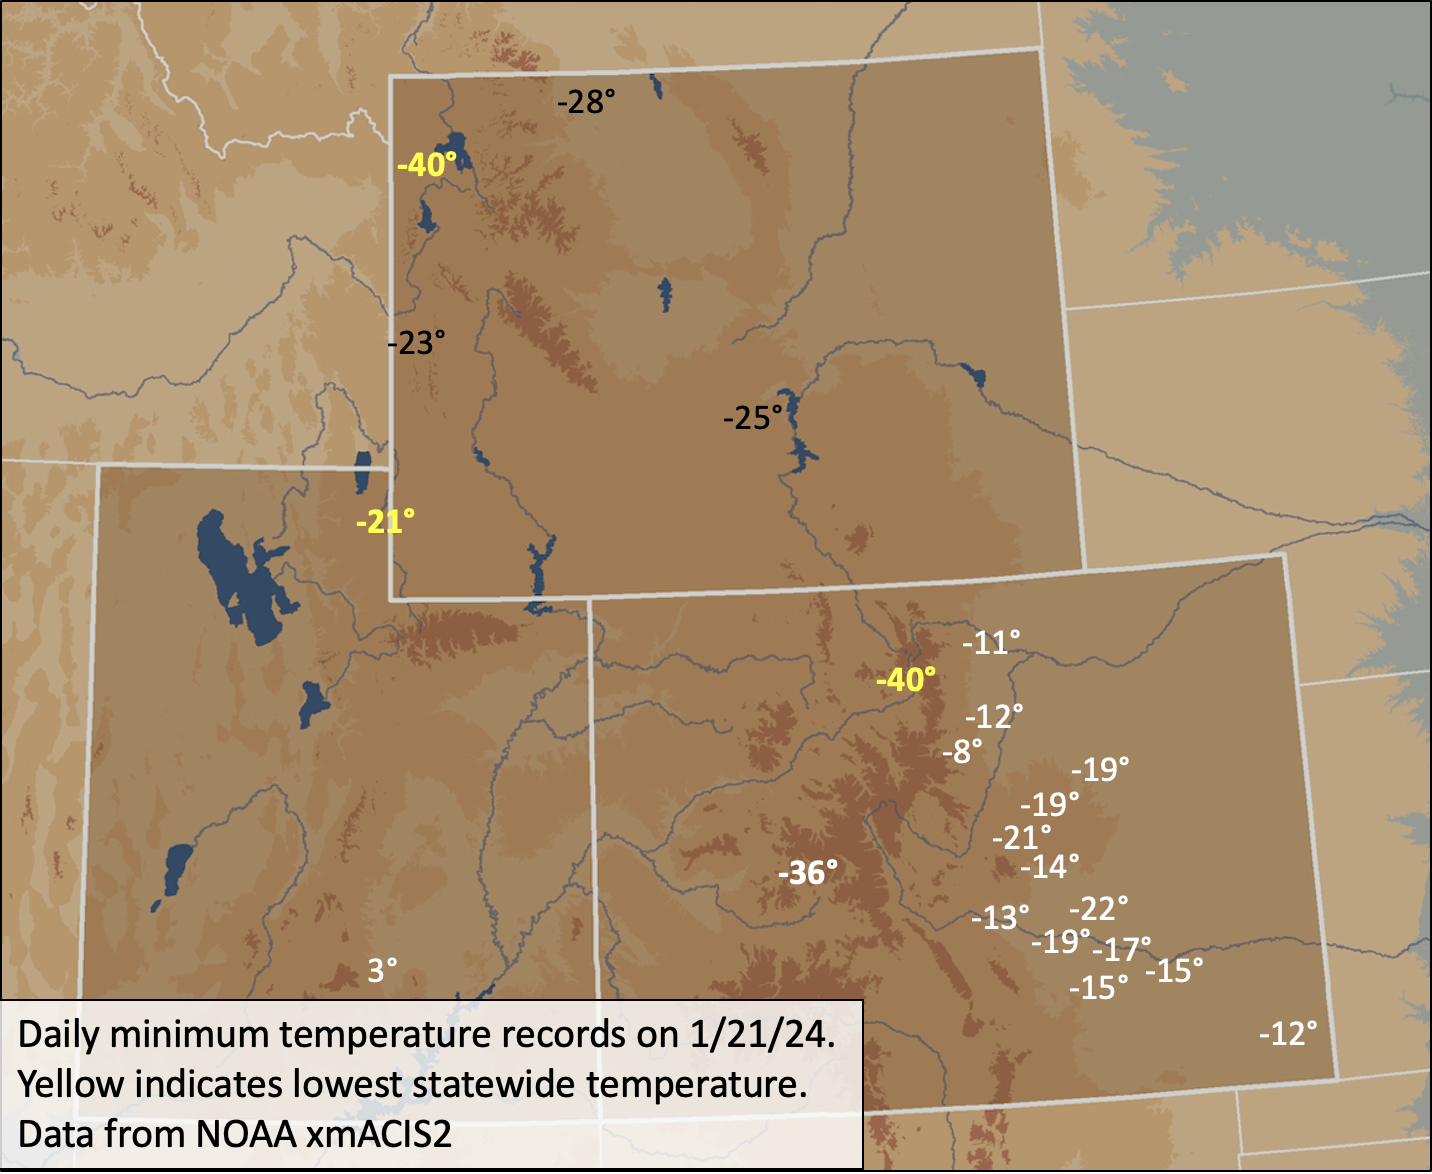
Significant weather event: Polar vortex descends on Intermountain West. A severe cold wave impacted the Intermountain West on January 19-23. Winter cold waves in temperate latitudes are sometimes referred to as a polar vortex. A polar vortex is an area of low pressure and cold temperatures that always occurs around the North and South Poles. During winter, the polar vortex periodically expands in size and covers more temperate latitudes; this is the source of a cold wave, or Arctic blast in the United States. The severity of the cold wave peaked on 1/20 and 1/21 in Wyoming and Colorado, with slightly warmer temperatures in Utah. Considering weather sites with at least 50 years of data, daily minimum temperature records were set at 9% and 17% of Colorado sites and 21% and 5% of Wyoming sites on 1/20 and 1/21. Daily minimum high-temperature records were set at 17% of Colorado sites on 1/20 and 30% of Colorado sites on 1/21. Temperatures were particularly cold in the lower Arkansas River valley with record daily minimum temperatures of -19ºF in Pueblo and -22ºF in Tacony, CO on 1/21. In Colorado, -40ºF was the coldest temperature of the event, observed at Harbison Meadow near Grand Lake. In Crested Butte, -36ºF was the coldest temperature recorded since 2011. The coldest temperature observed in Wyoming, while not a daily record, was a frigid -40ºF at Old Faithful in Yellowstone, the site’s coldest temperature since 2016. The cold wave was not as severe in Utah as a whole, but a unique site at Peter’s Sink in northern Utah bottomed out at -56.1ºF. In case you were wondering, the coldest recorded temperature in the Lower 48 was -69.7ºF at Rodger’s Pass Montana; the second coldest temperature recorded was at Utah’s Peter’s Sink where temperatures dipped to -69.3ºF in 1985. For the week surrounding the cold wave, average temperatures were 15ºF to 20ºF below normal for large parts of Colorado and Wyoming with small areas up to 25ºF below normal.